Access all information through the Viindoo Dashboard
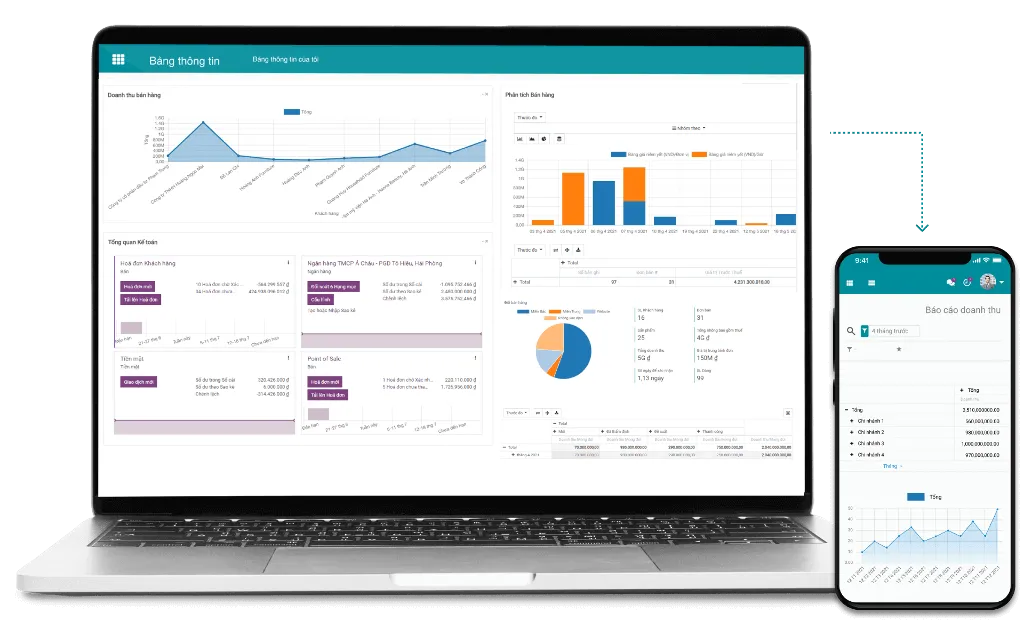
Viindoo Dashboards provide users with a tailored environment in which they can easily assess their information in real time, increasing workplace efficiency.
Select the reports that are frequently viewed through a single "Dashboard" instead of accessing every menu.
Useful for leaders because all necessary information is gathered in reports, data analysis.
Different reports in one interface provide a comprehensive and multi-dimensional picture of business resources.
Compilation of reports from various applications: Event report; Expense report; Attendance report; Online chat report; Retail sales report; Purchase report; Sales report: Expense and sales report; Sales report related to timesheets; Inventory report; E-learning report.
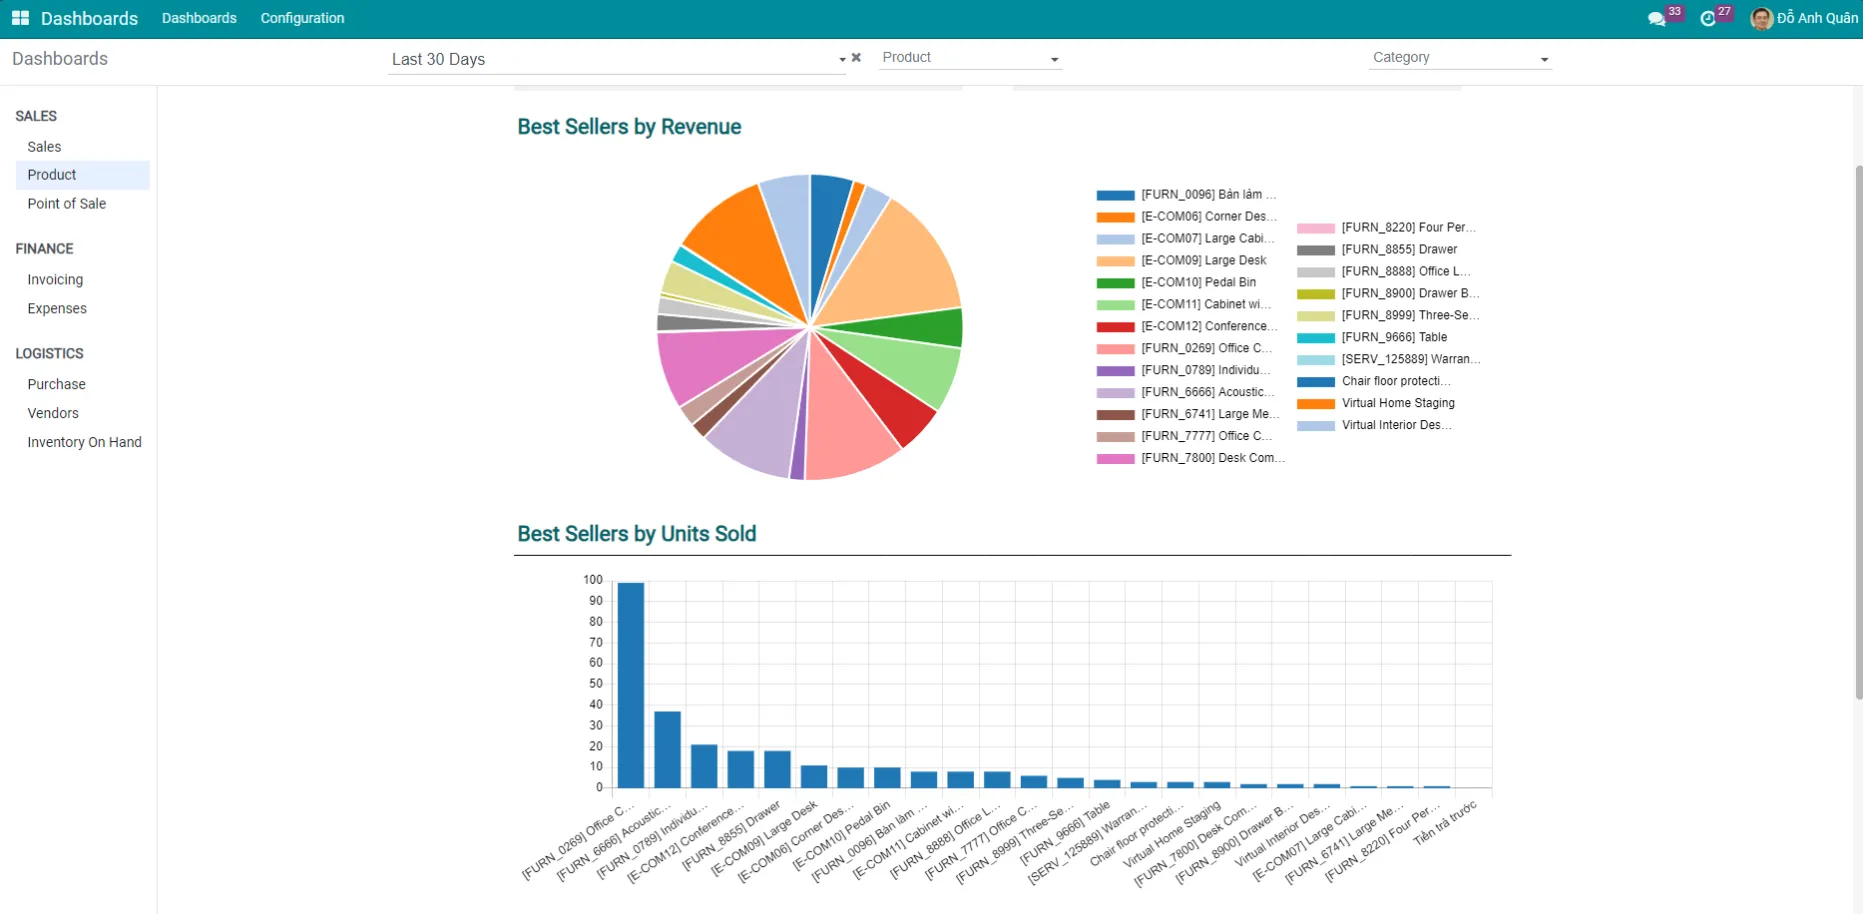
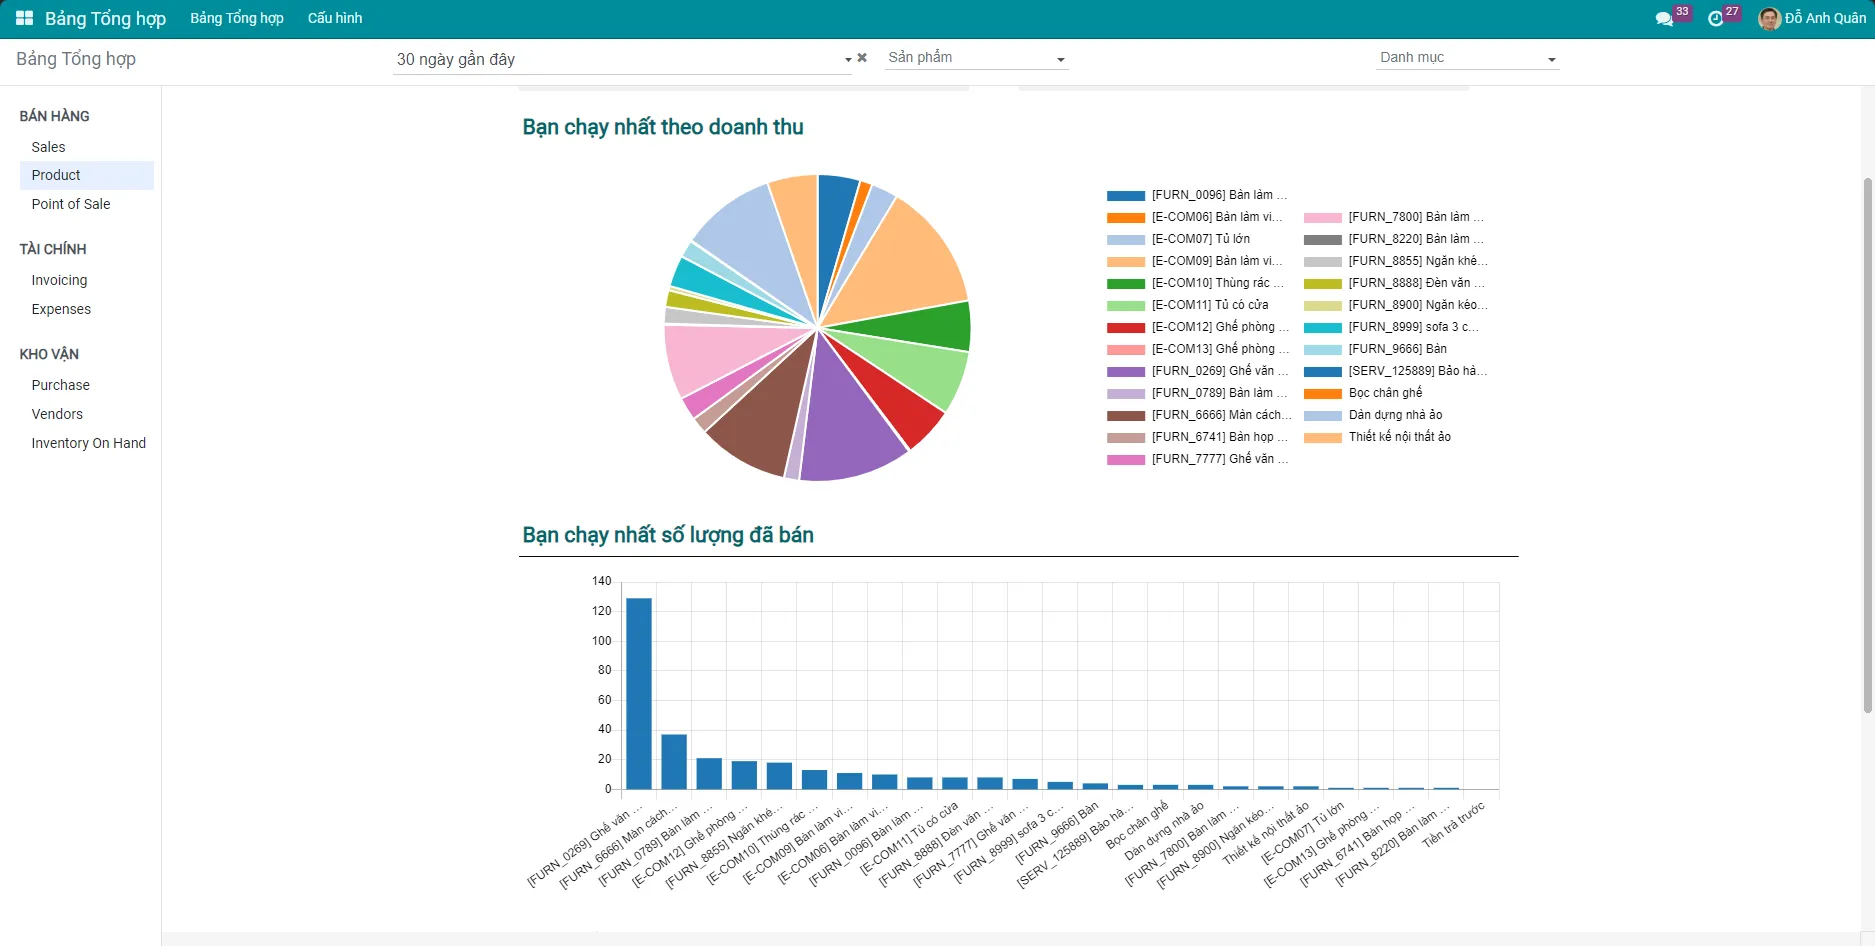
Main features of Viindoo Dashboards
Designing for concentration
Access data from various sources


Visual interface
Information is displayed from multiple perspectives with visually represented data charts:
- Kanban view mode
- List view mode
- View schedule
- Summary table
- Chart view mode
- View activity mode
- Gantt chart
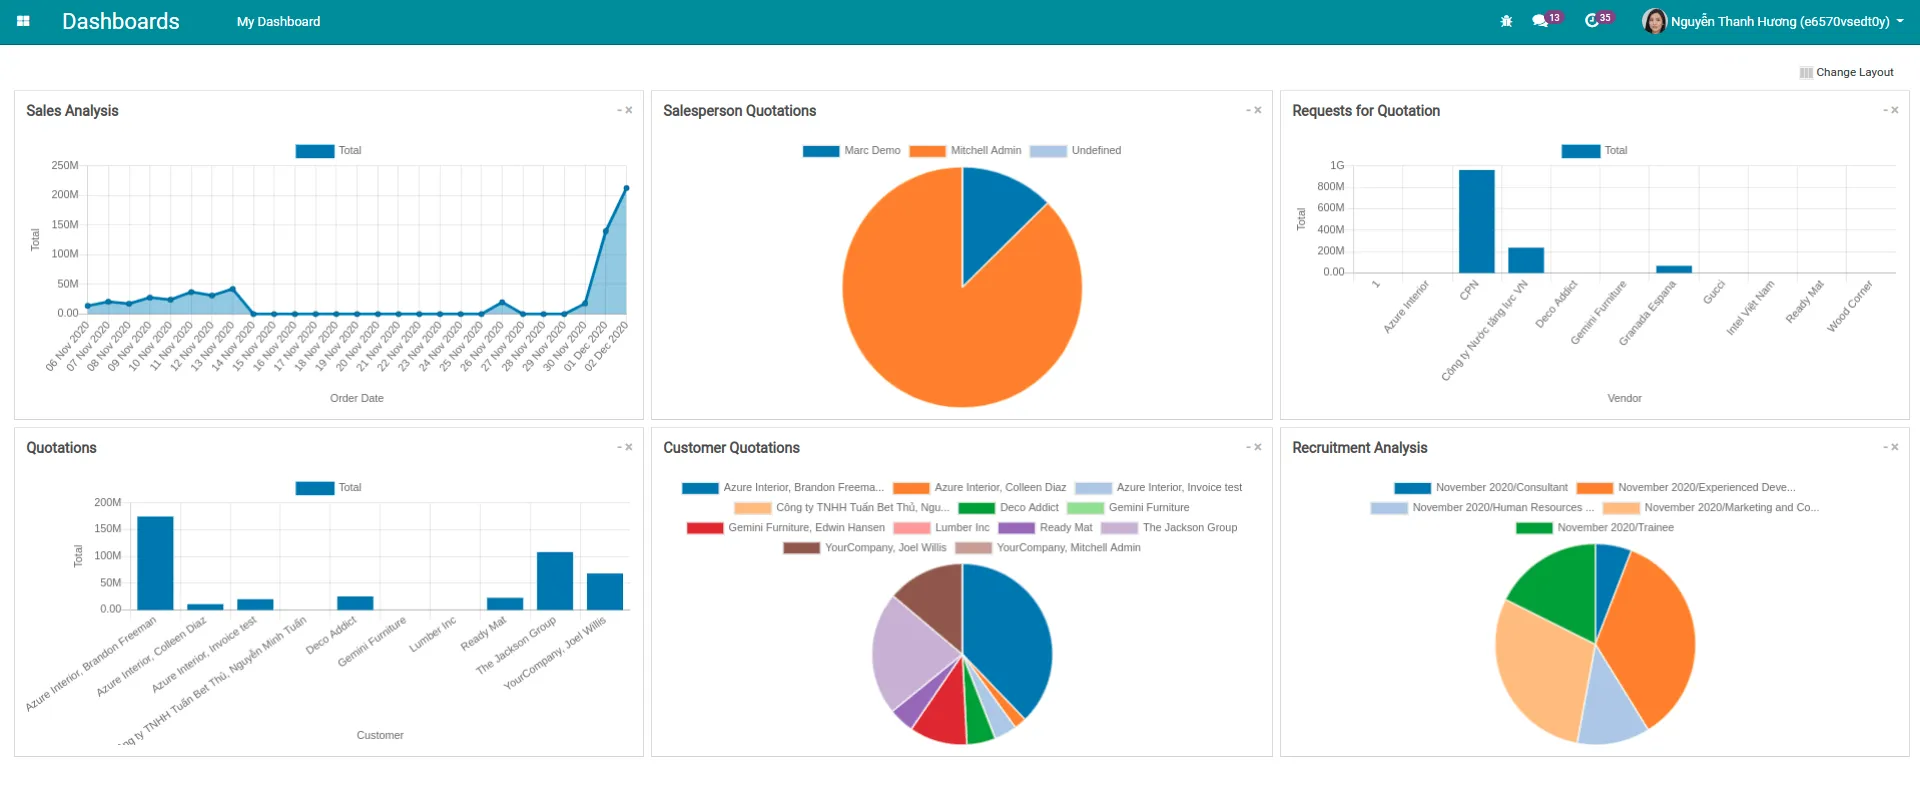
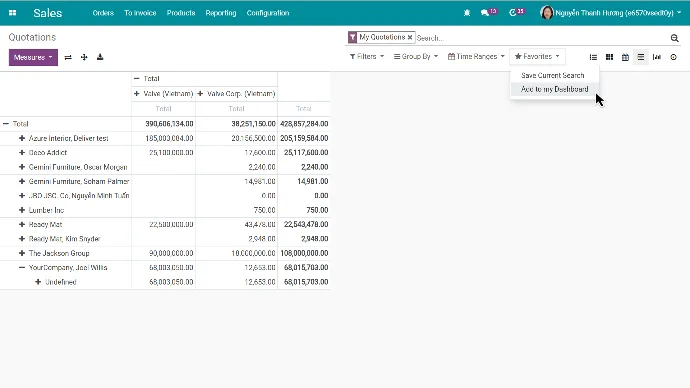
Easy customization
You can edit, select data, choose how this data is displayed, and update information in this Dashboard.
Instant update
Compatible with mobile devices
By simply connecting to the internet, you can access the Viindoo Dashboard to monitor information anytime, anywhere using a mobile device.
Fully integrated with other Viindoo applications
Sales
Collect data from orders, invoices, inventory, and payments for automatic reporting.
Viindoo Sales

Purchase
Create statistics on the number of orders, prices, and invoices for each order.
Viindoo Purchase
Accounting
Create a dynamic, multi-source financial report with easily trackable items.
Viindoo Accounting

Inventory
Display reports in various ways: summary table, pie chart, bar chart, etc...
Viindoo Inventory
Get FREE Viindoo Dashboard forever!
Start now to increase the competitiveness of the Enterpris
