Loan Management Reports
Loan management reports are essential tools for financial institutions and lenders to monitor and analyze their loan portfolios. These reports provide valuable insights into the performance of loans, identify potential risks, and aid in decision-making processes.
Requirements
This tutorial requires the installation of the following applications/modules:
Pivot reports
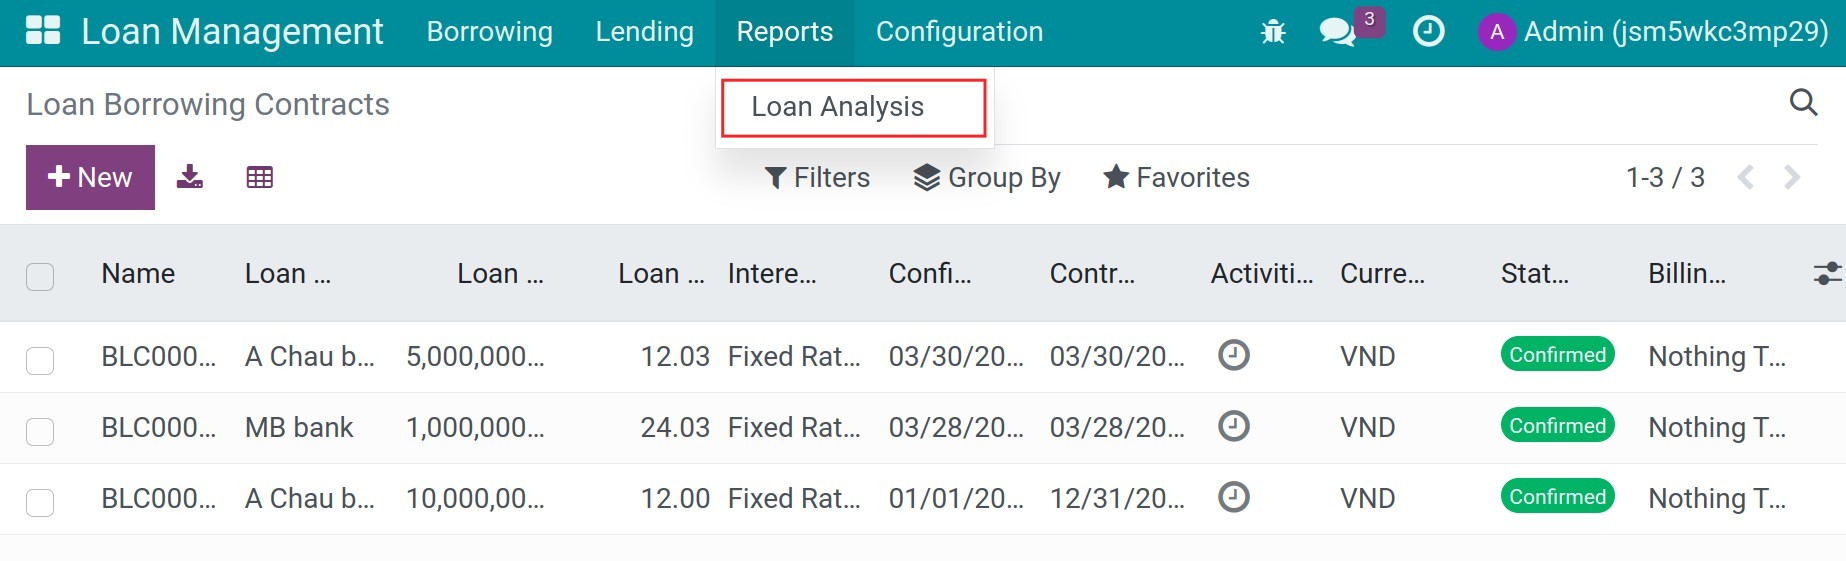
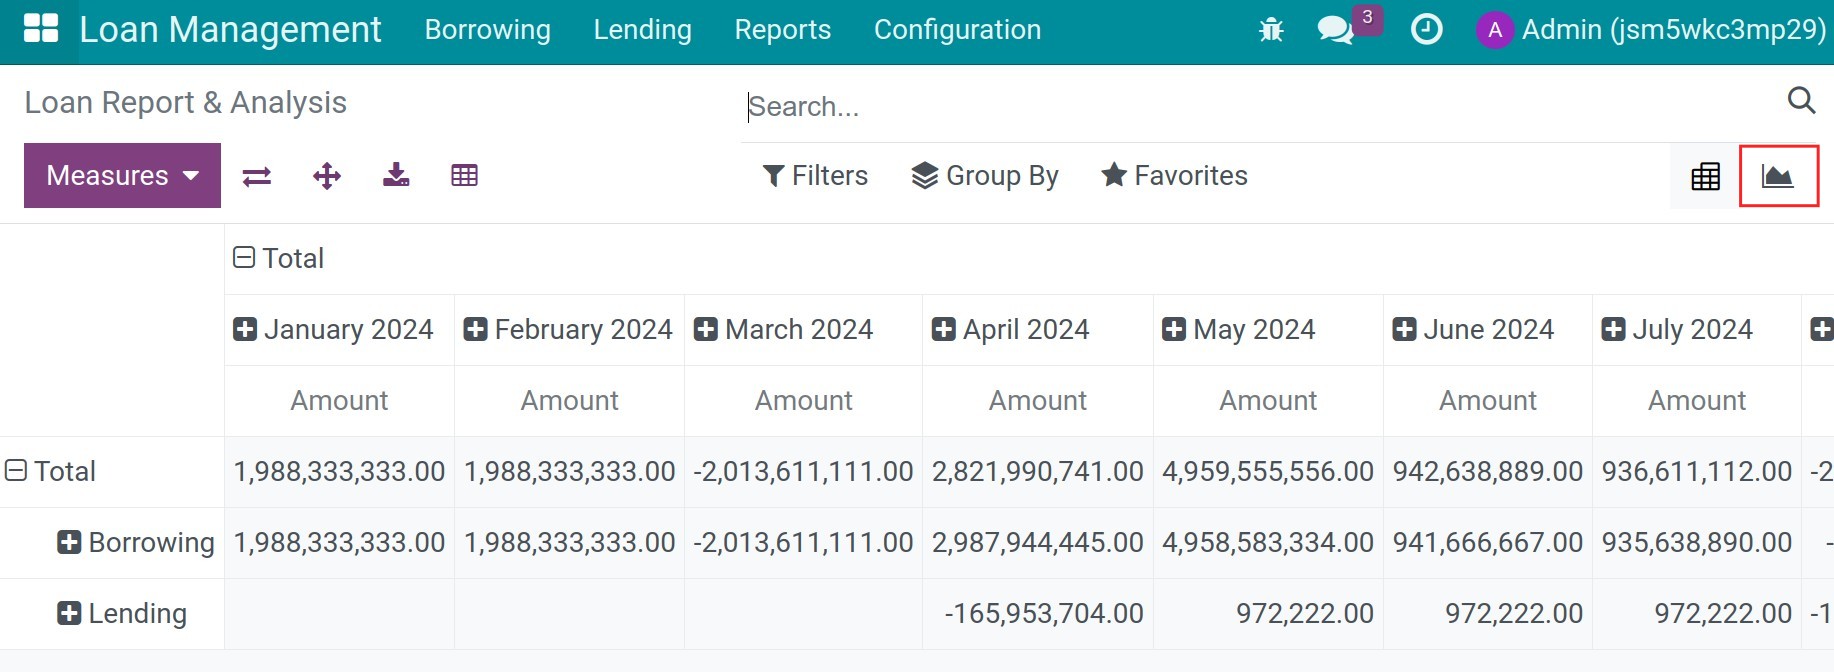
To see the loan analysis in pivot, you can navigate to Loan management > Reports > Loan Analysis:
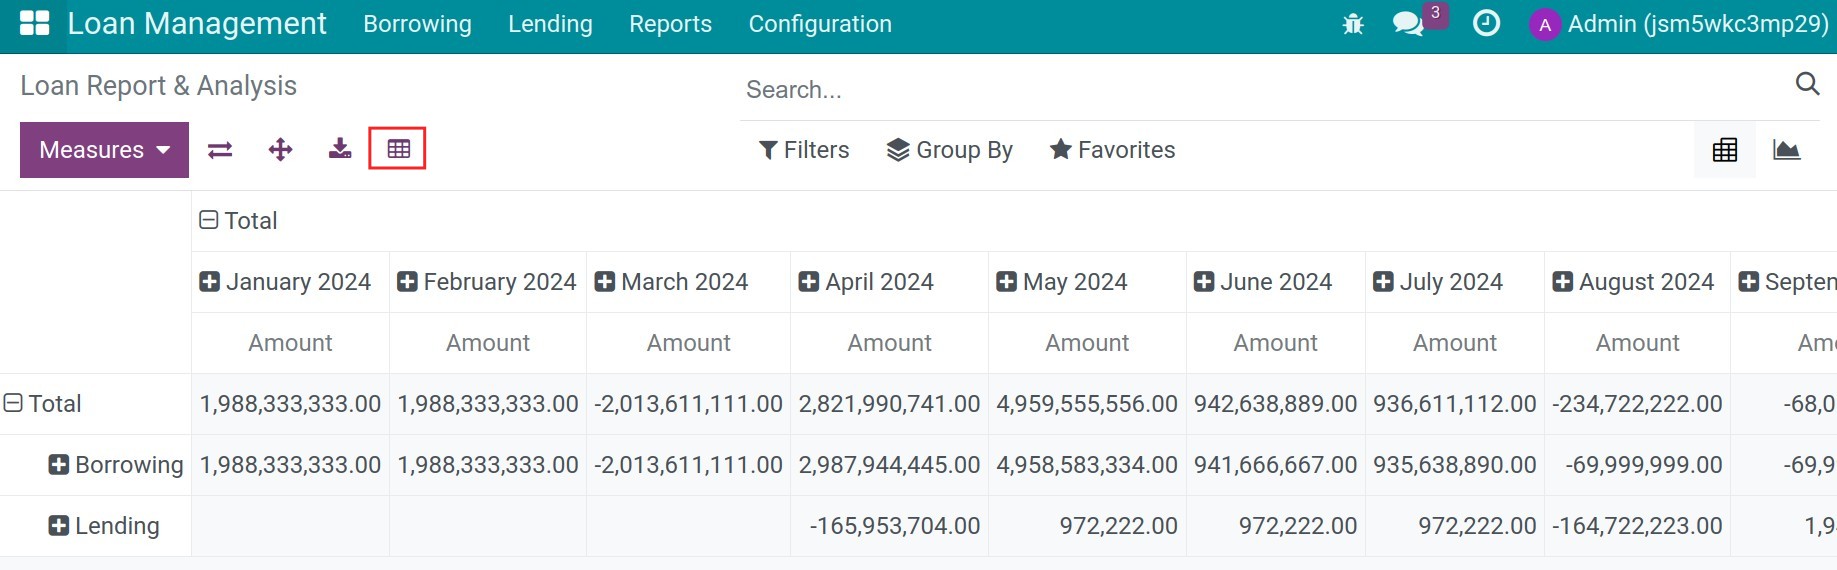
Choose the pivot icon.
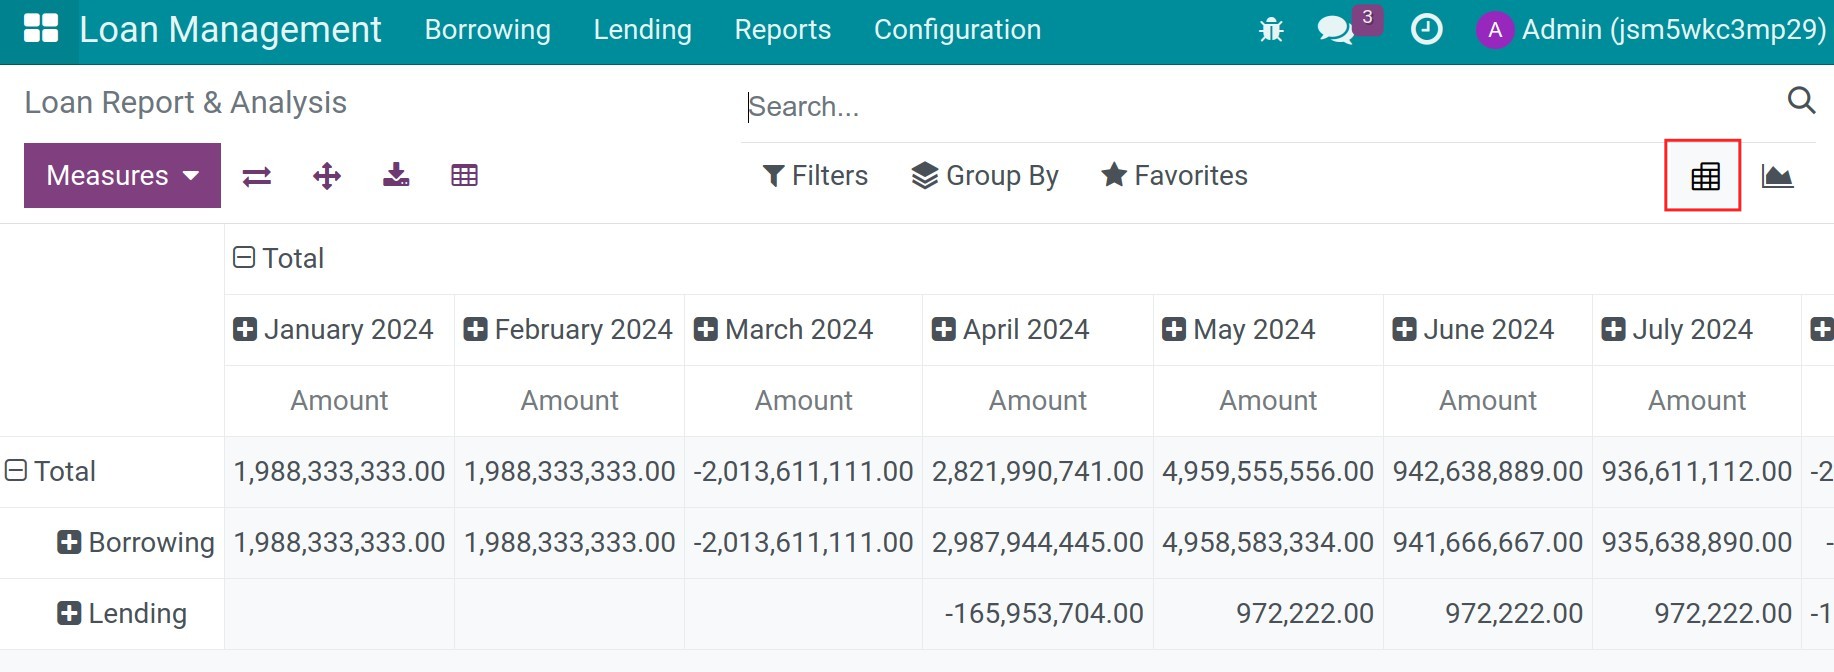
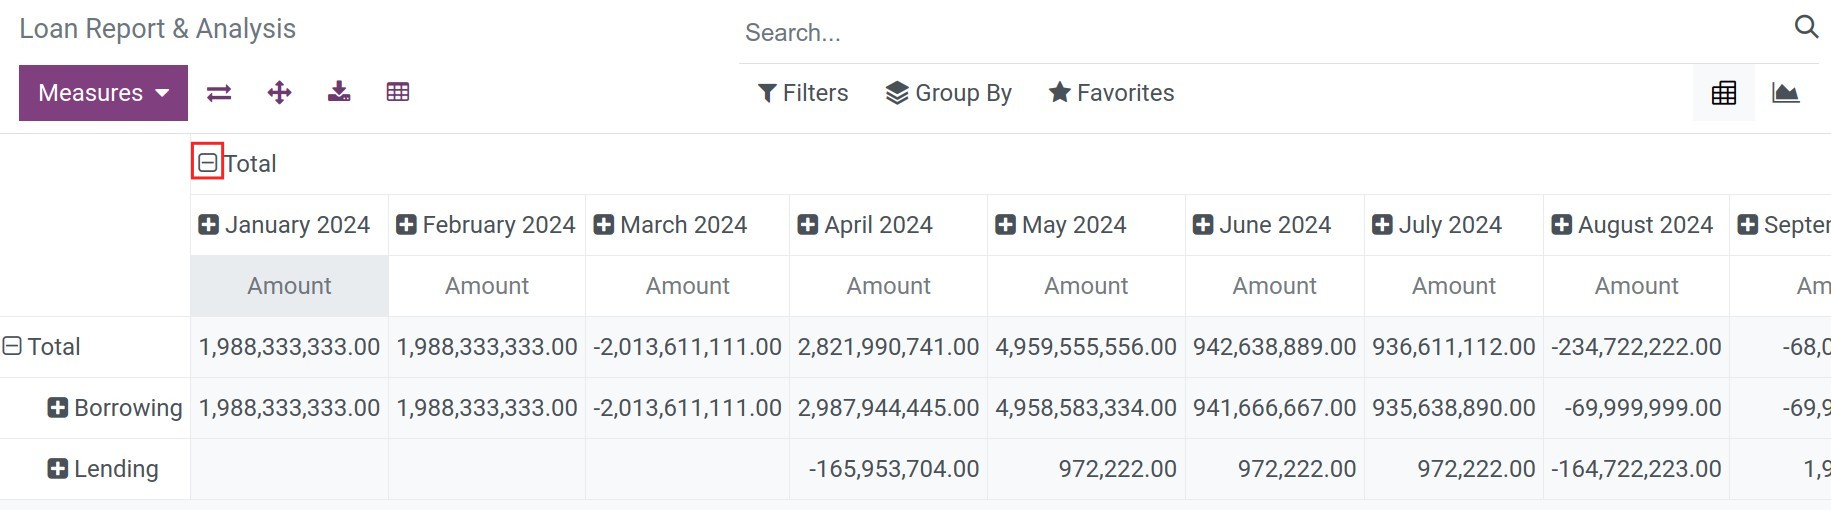
In defaut, you can imediately see the report month by month of the borrowings and lendings.
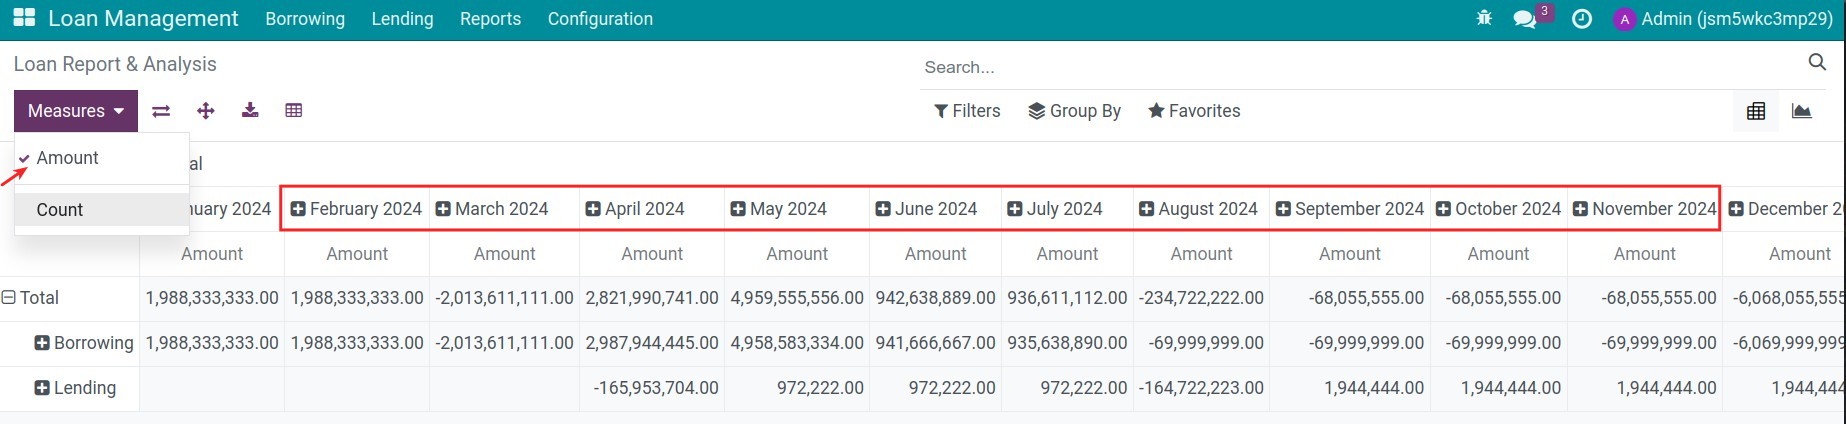
Here, you can choose other criteria for analysis by pressing to the + icon next to criterias:
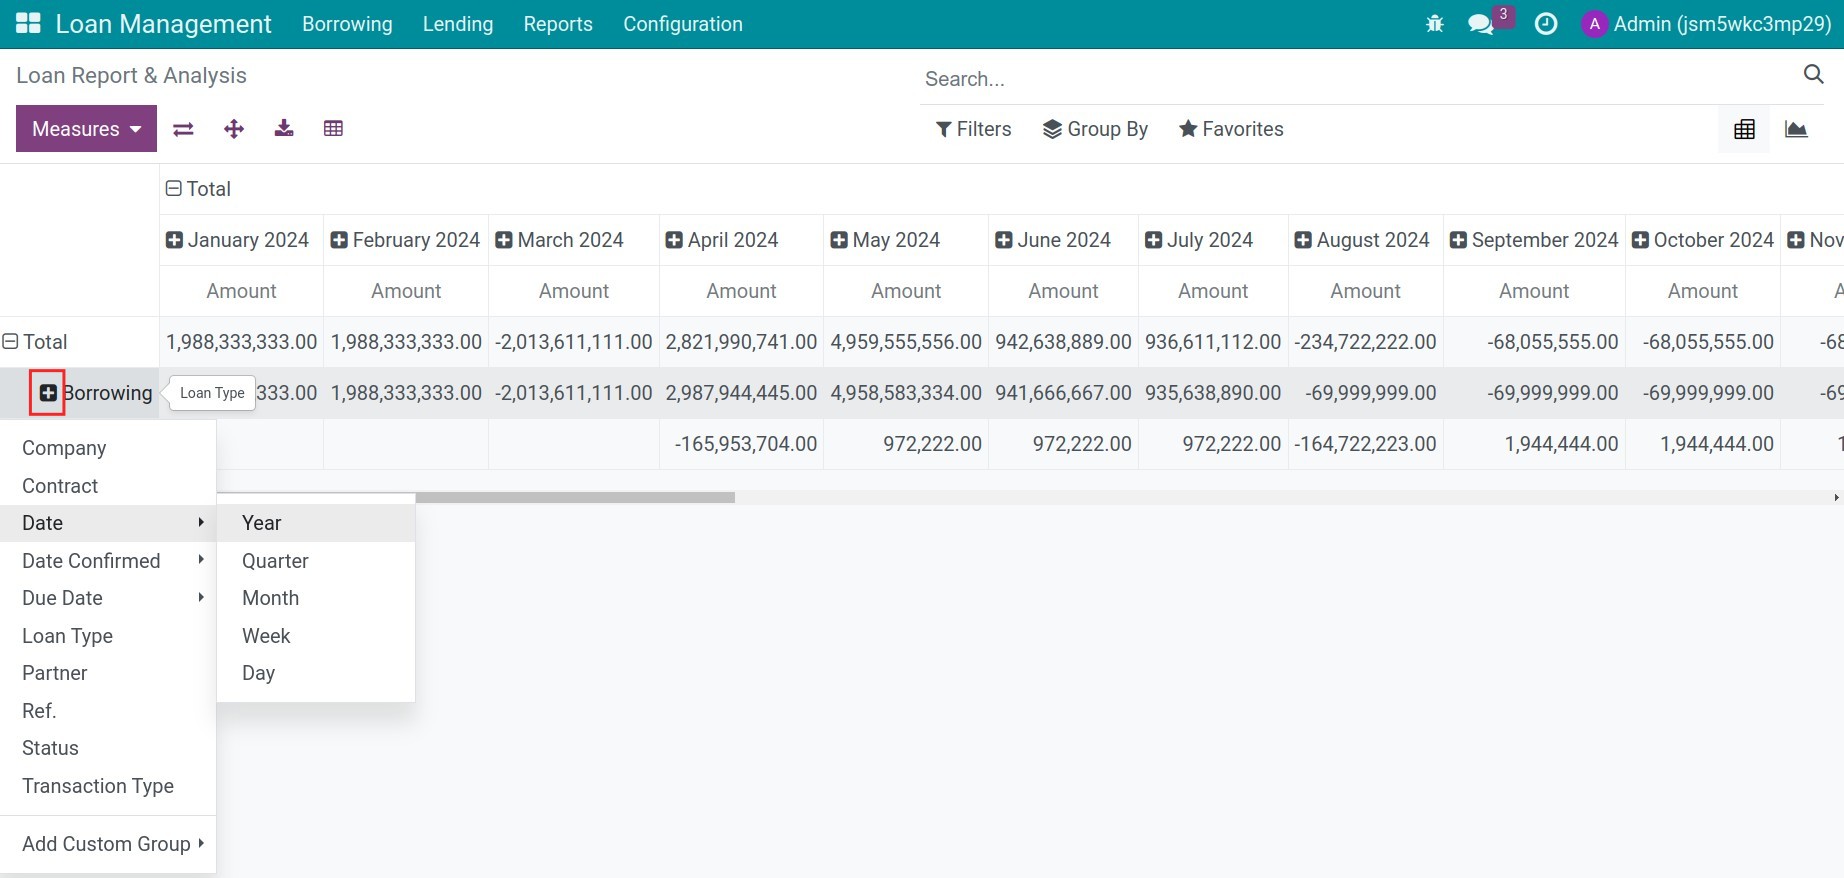
If you want to remove this criteria, you can press to the - icon:
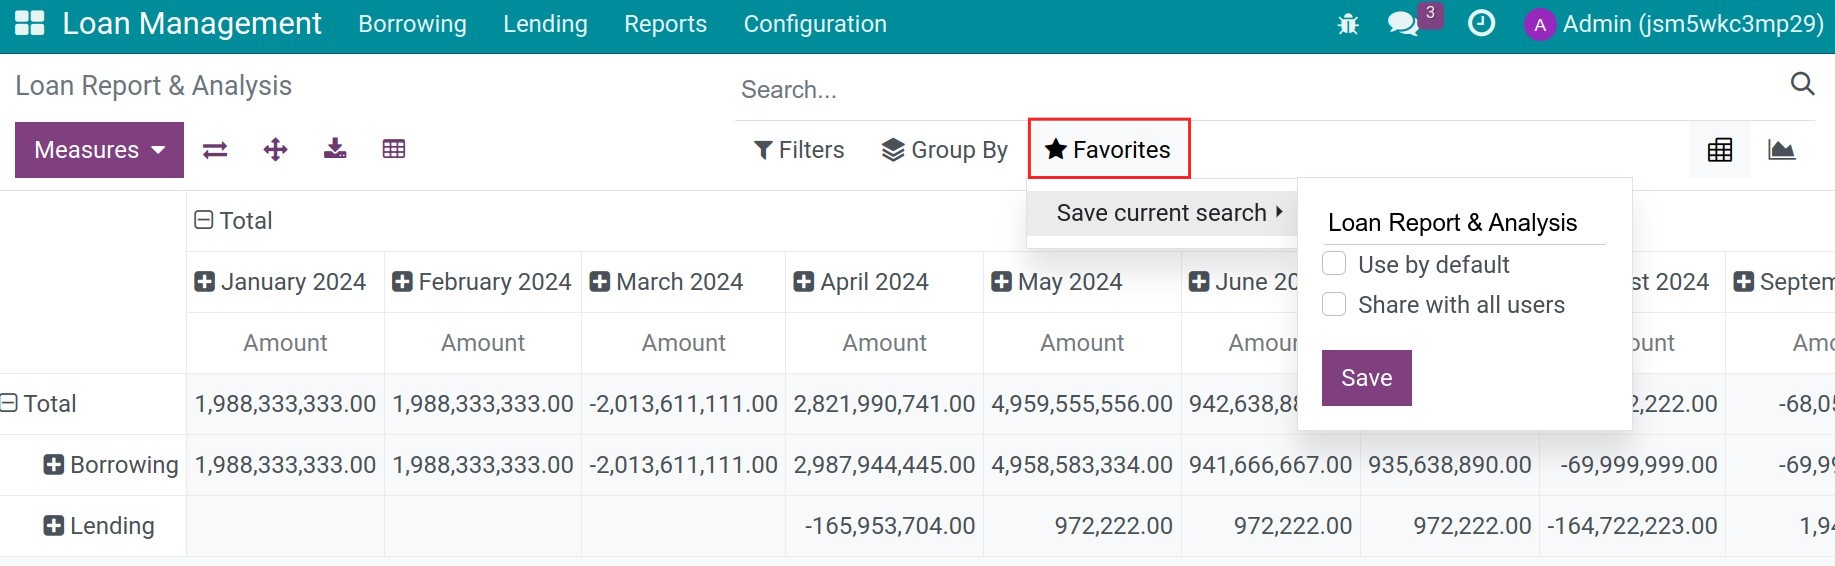
You also can save this report to the Favorites to use often later.
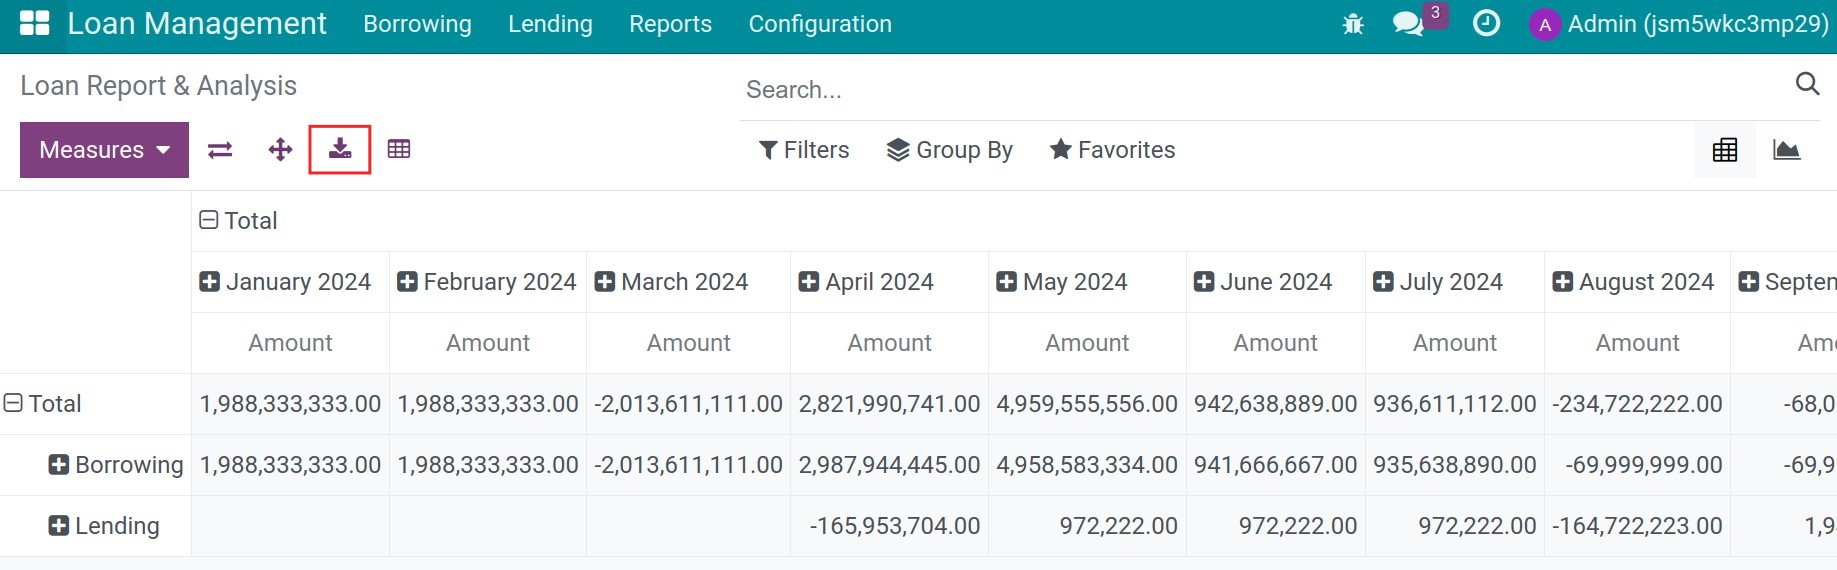
Or you can download this report into the Excel file.
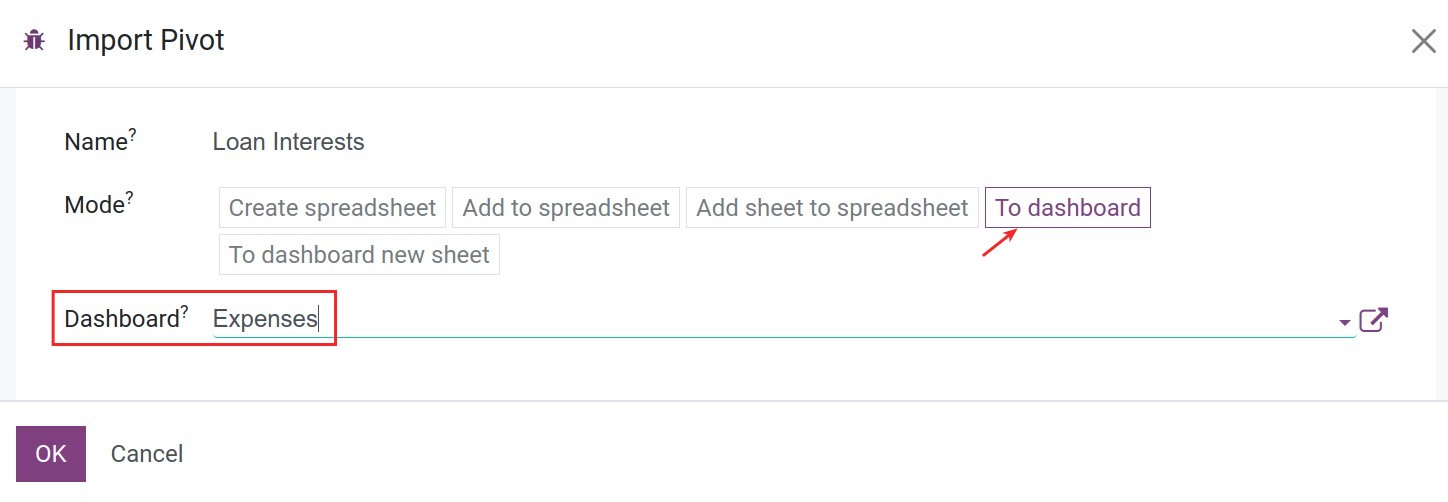
You also can add this report into the Dashboard.
Graph reports
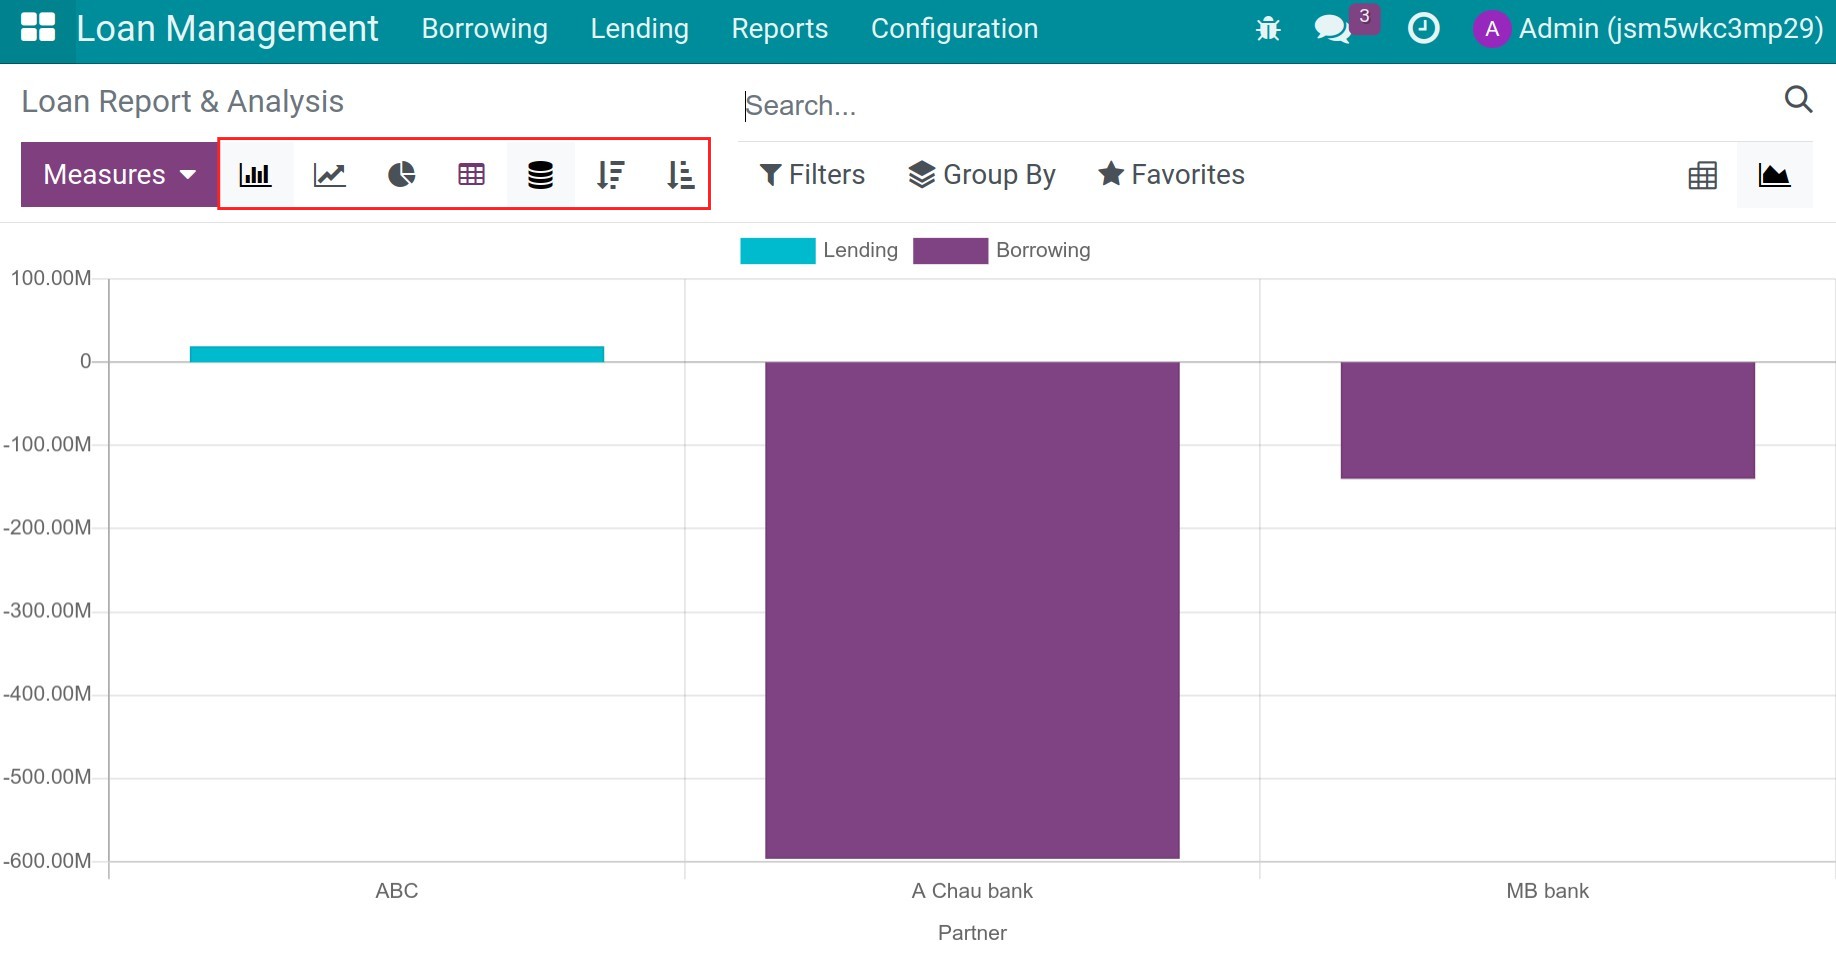
To see the loan analysis in graph, you can navigate to Loan management > Reports > Loan Analysis:
Choose the graph icon.
You can choose the active type of graph to visualize the reports
See also
Related articles:
Optional modules: