Employee Expense Report
Requirements
This tutorial requires the installation of the following applications/modules:
In the Viindoo Expenses app, you can navigate to Reporting > Expenses Analysis to view the expenses reports with many report types:
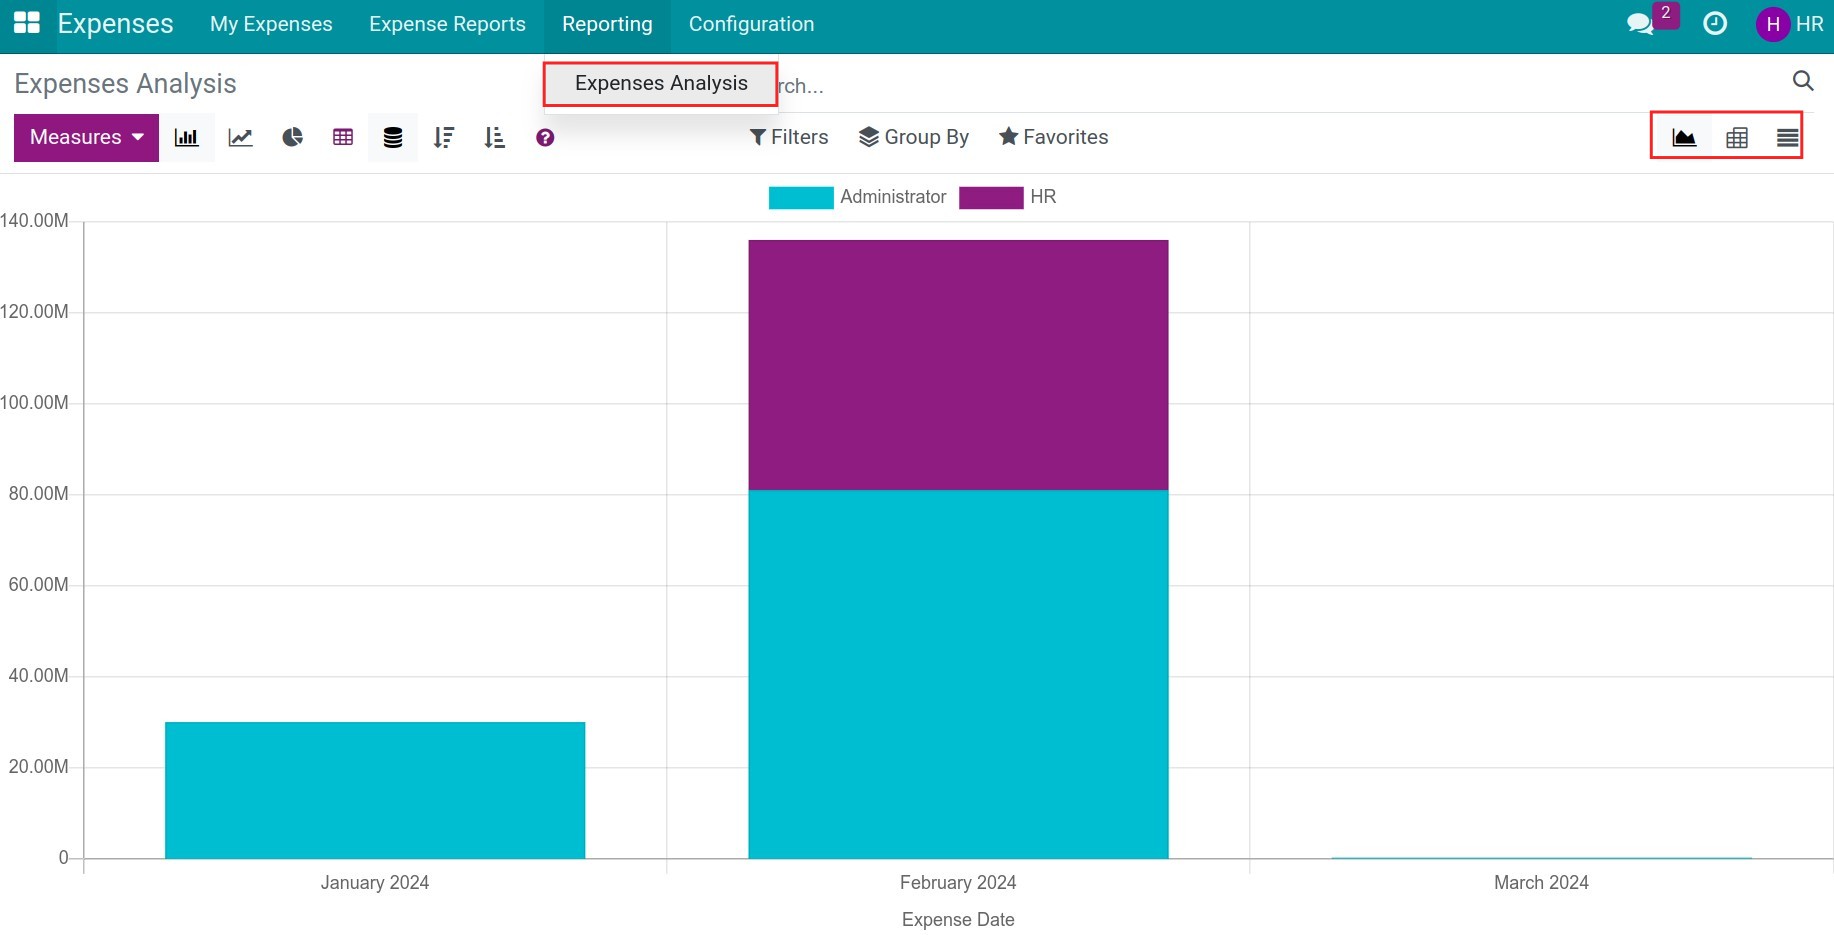
Bar, line, and pie chart
Pivot report
List report
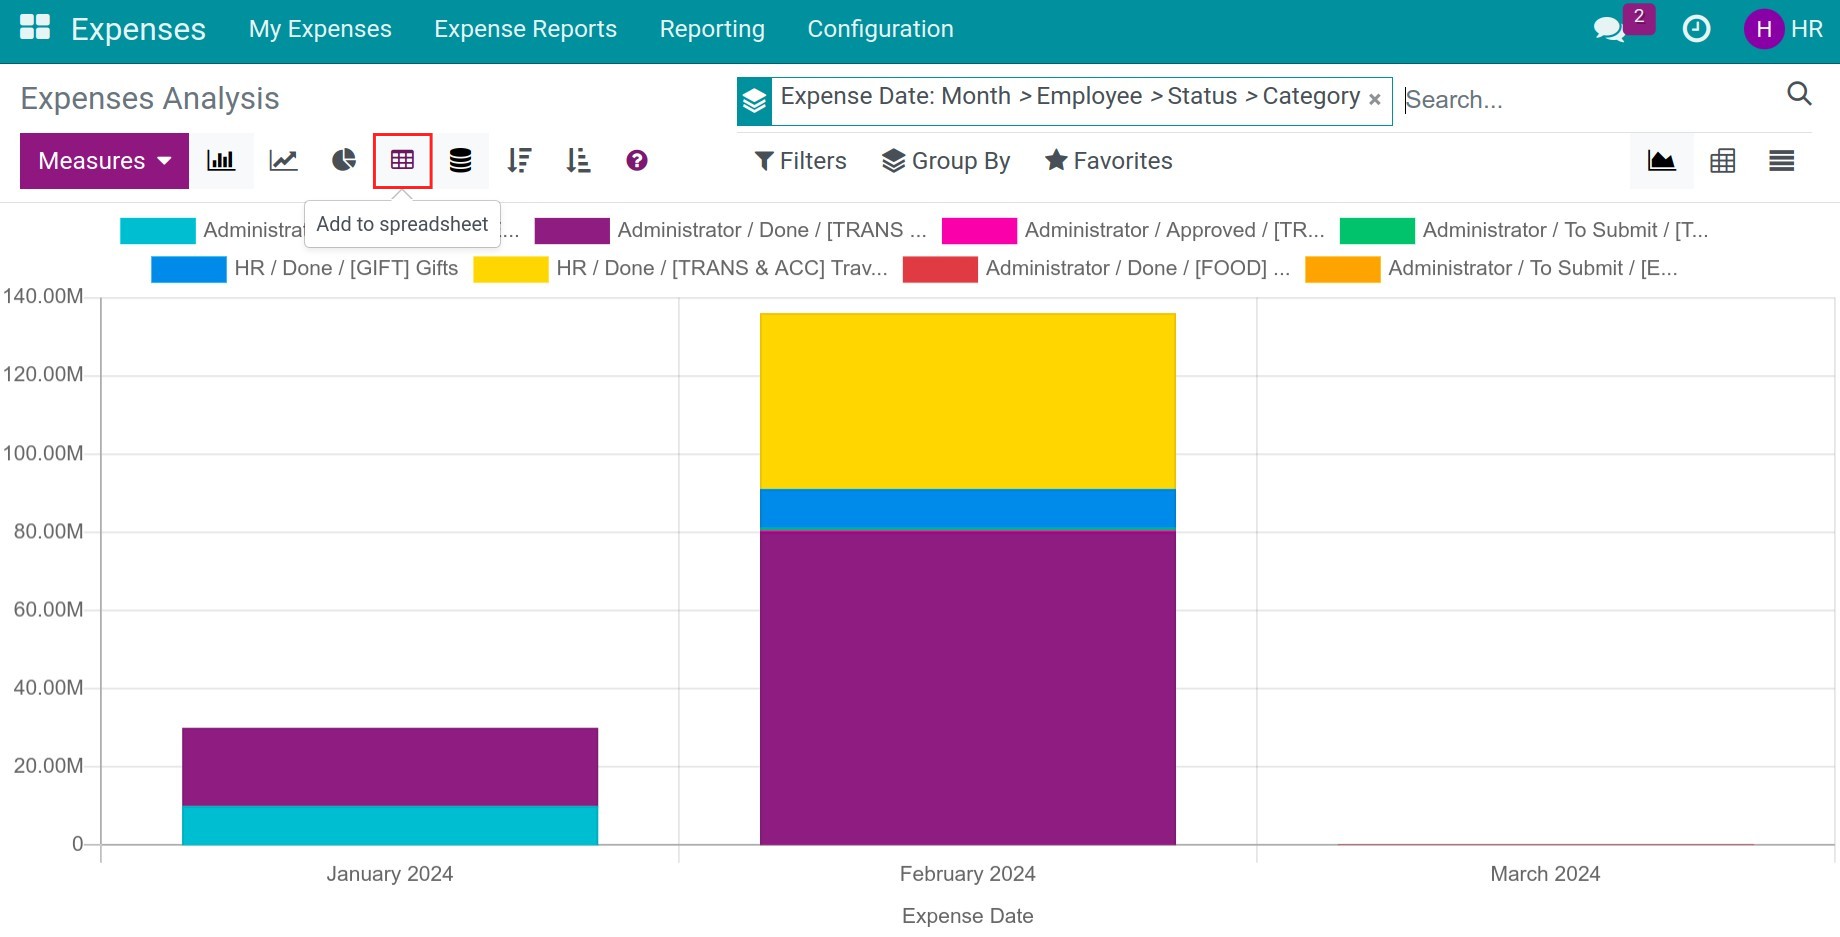
Expenses Report in bar, line, pie chart
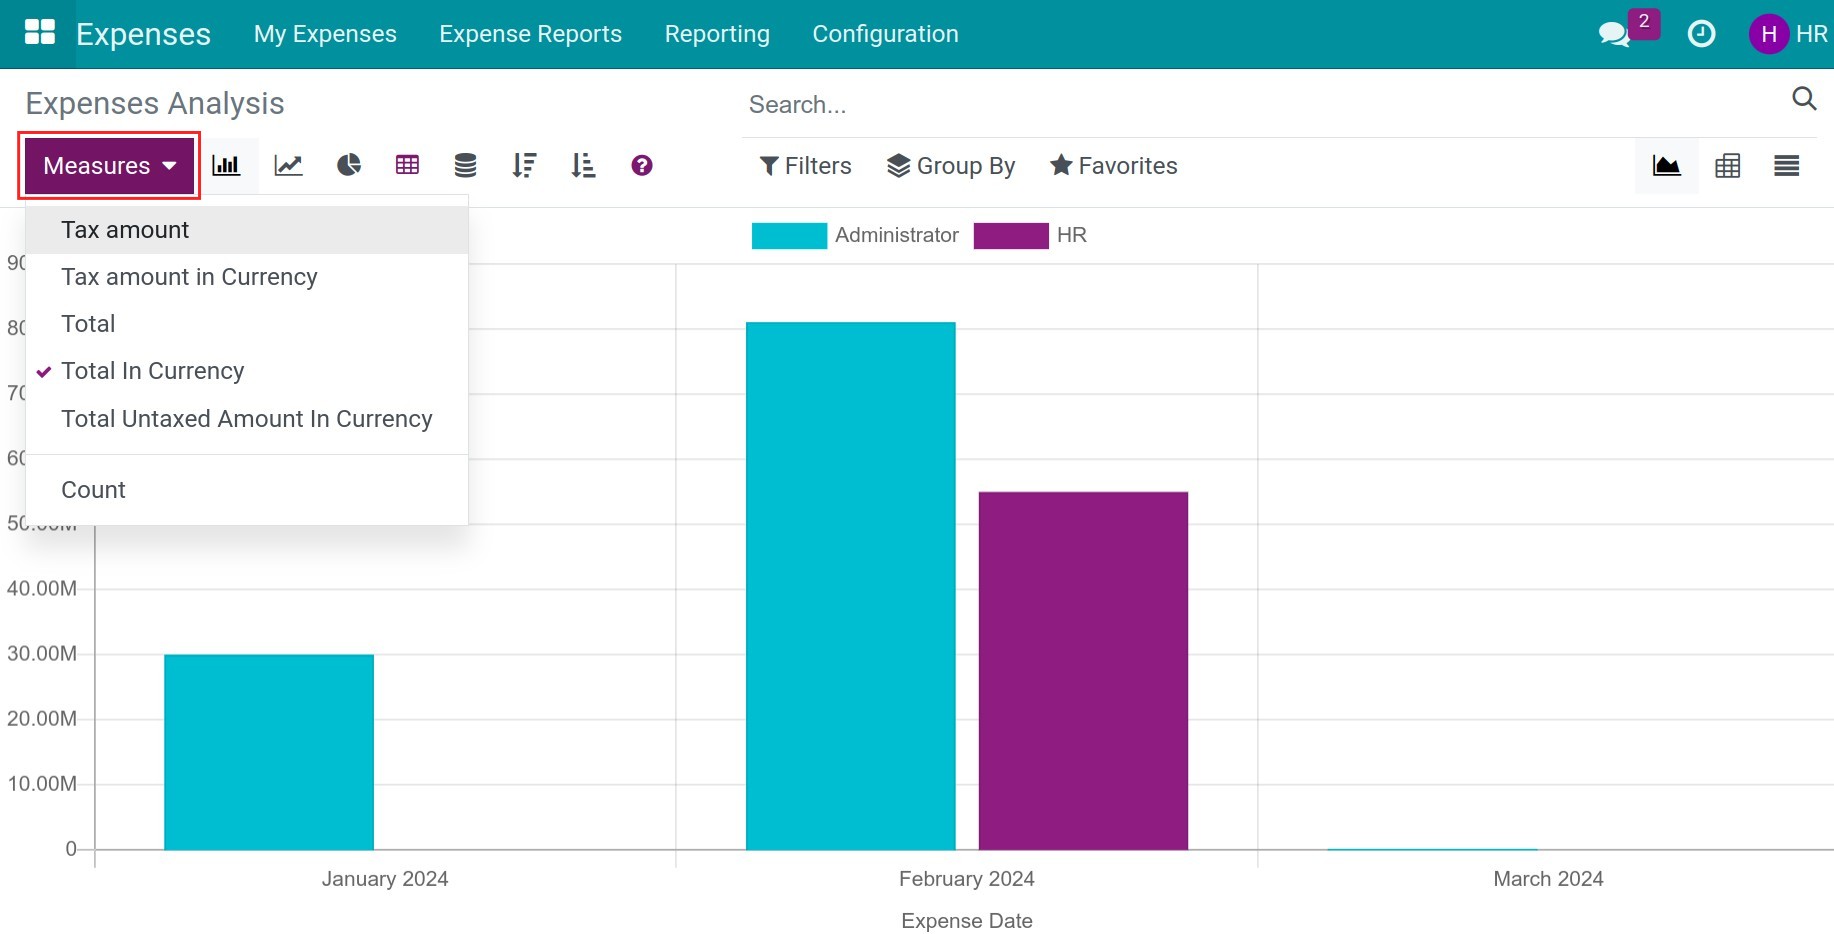
At the Expenses Analysis view in the Expenses app, press the View graph icon to view the reports in the bar, line, and pie chart.
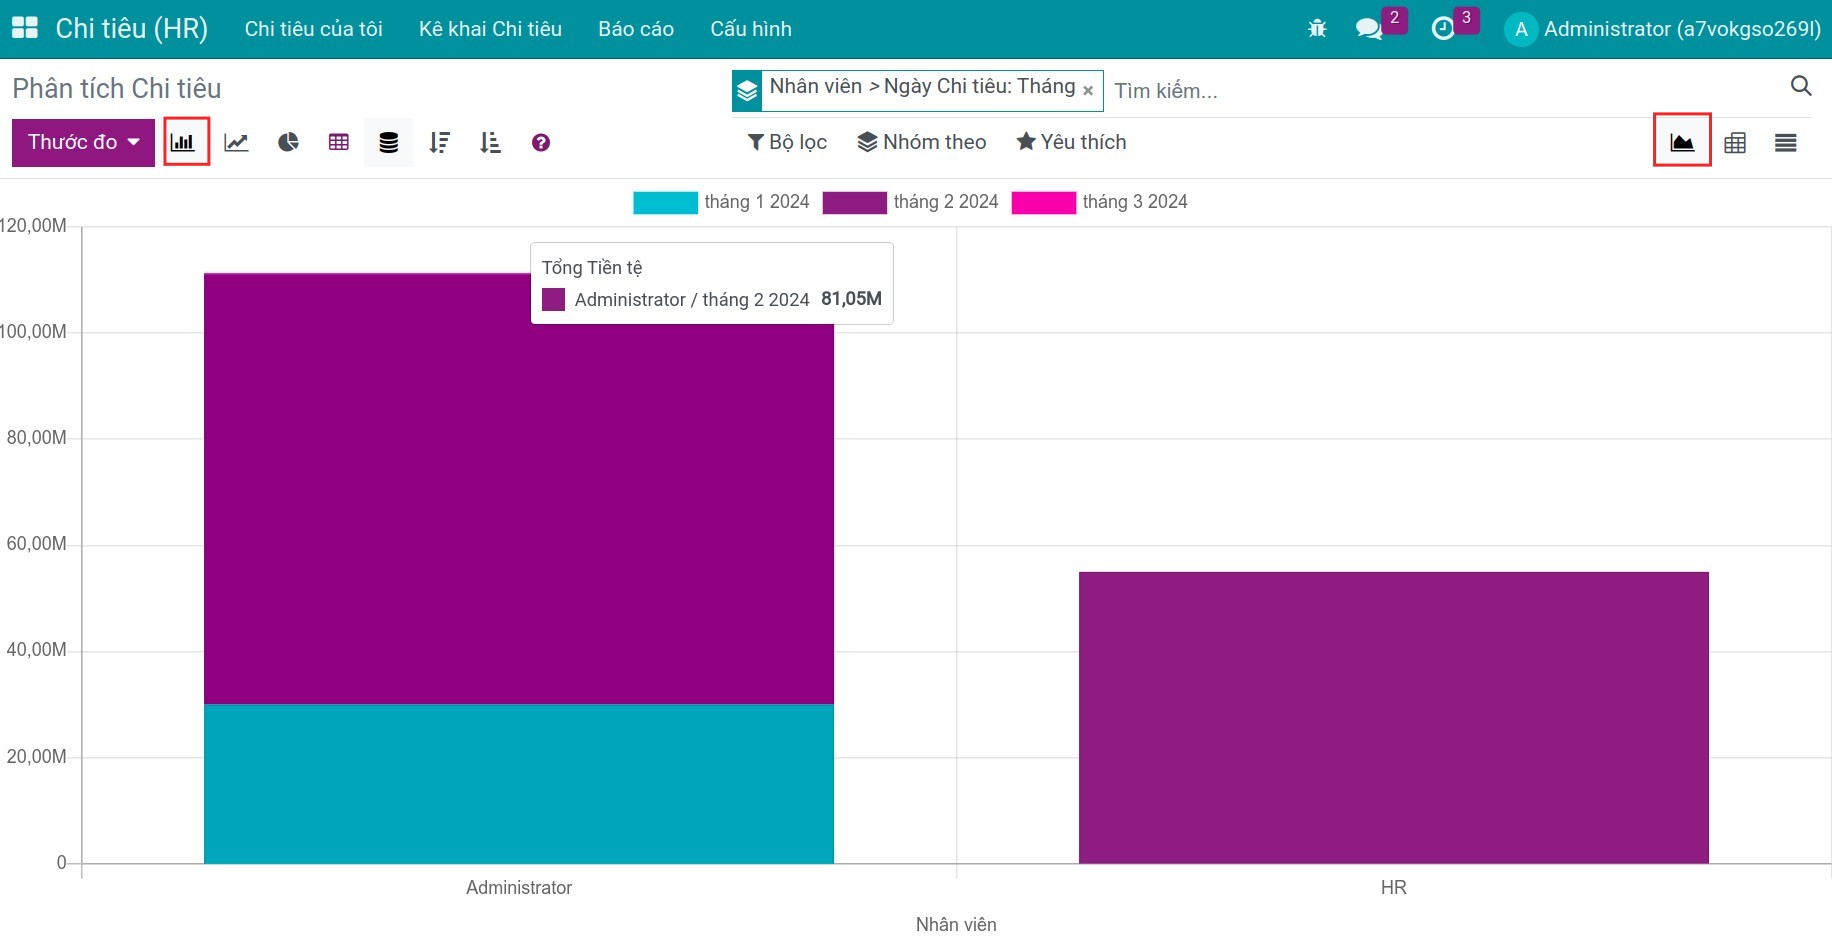
Bar chart
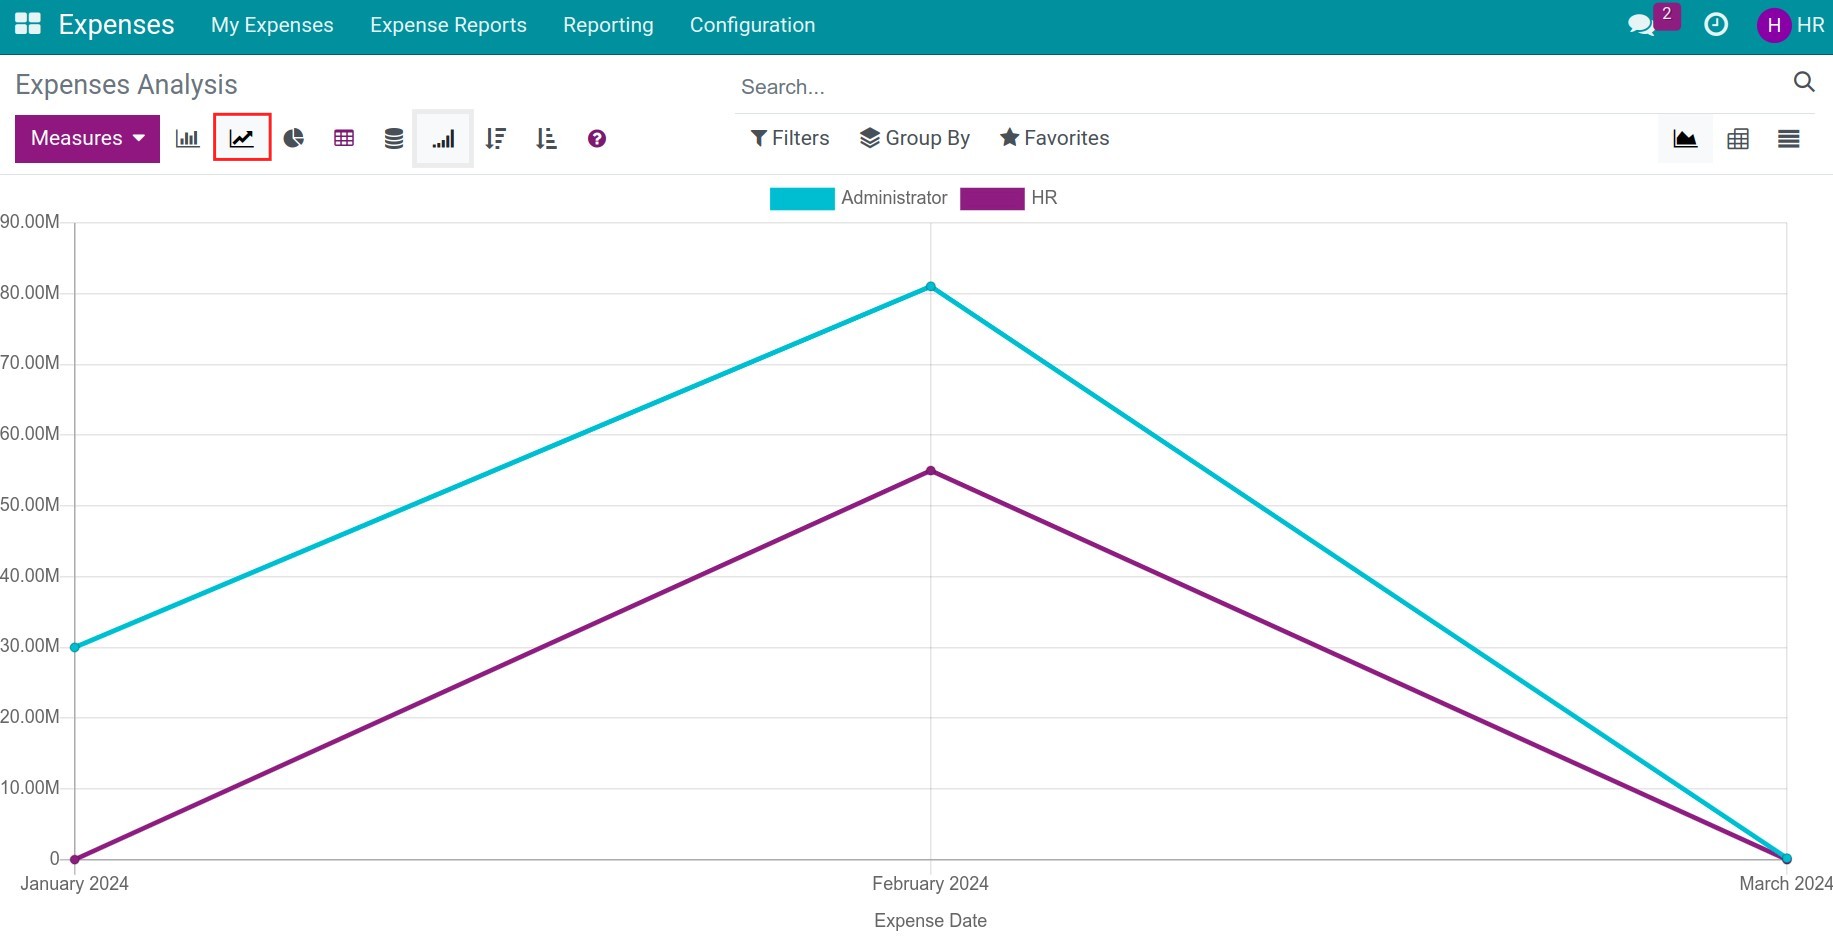
Line chart
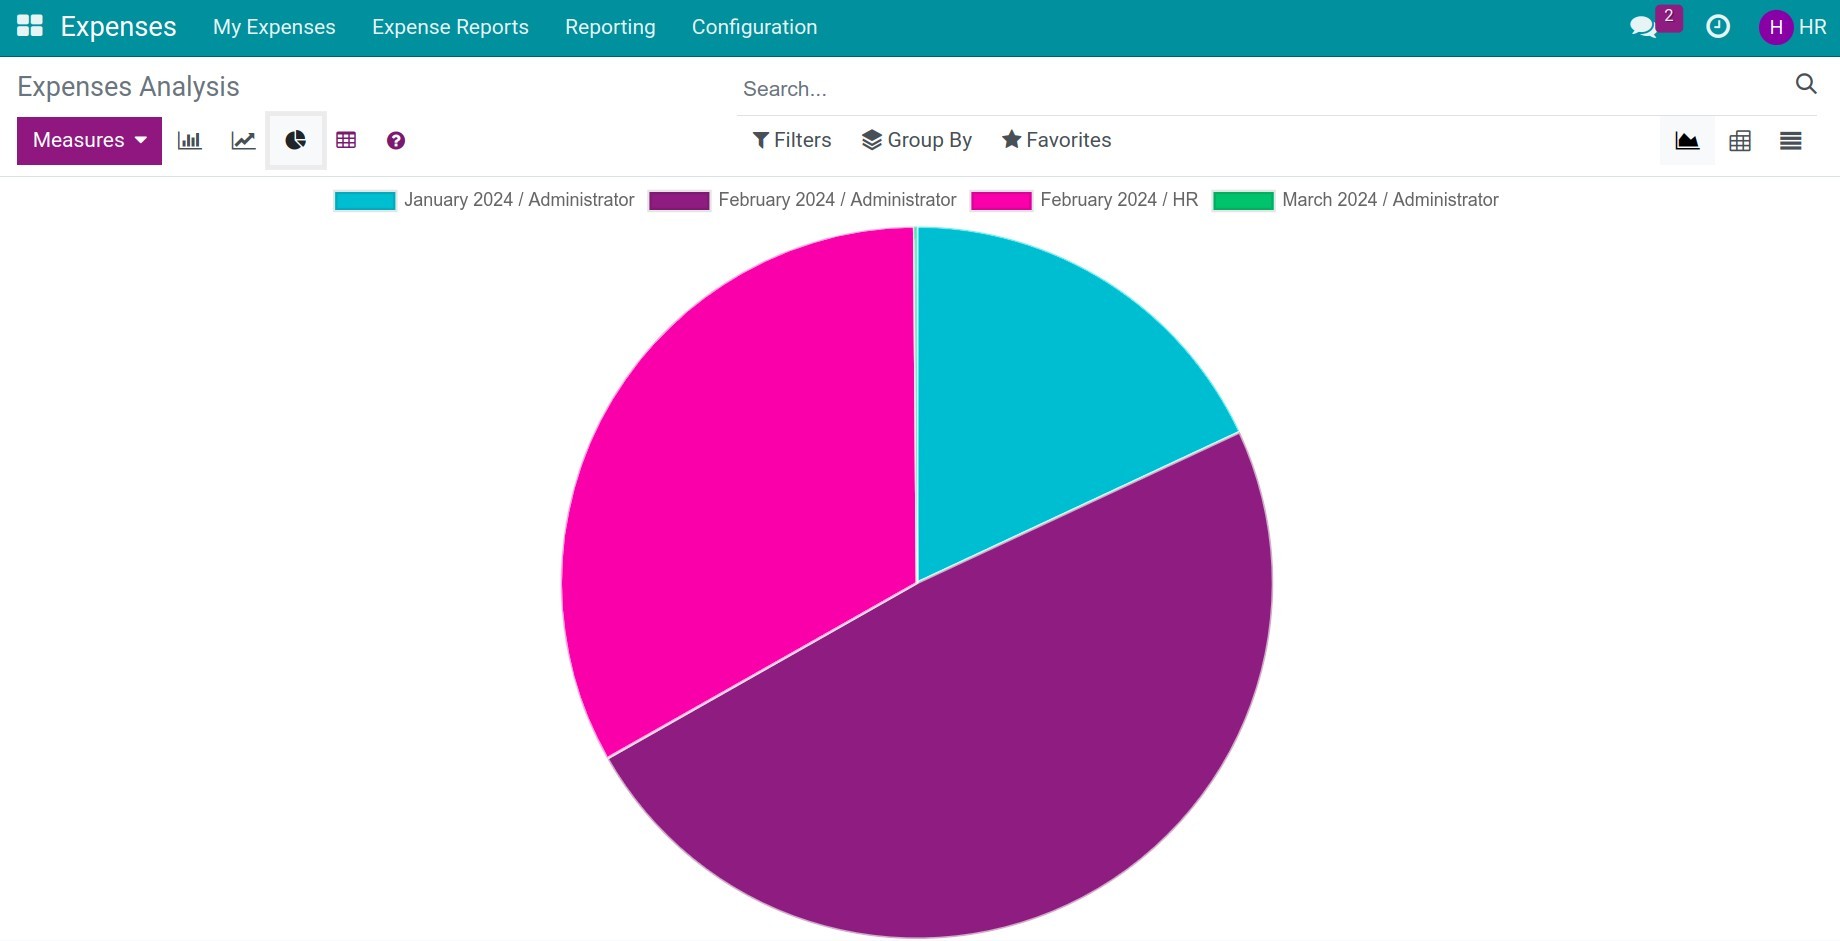
Pie chart
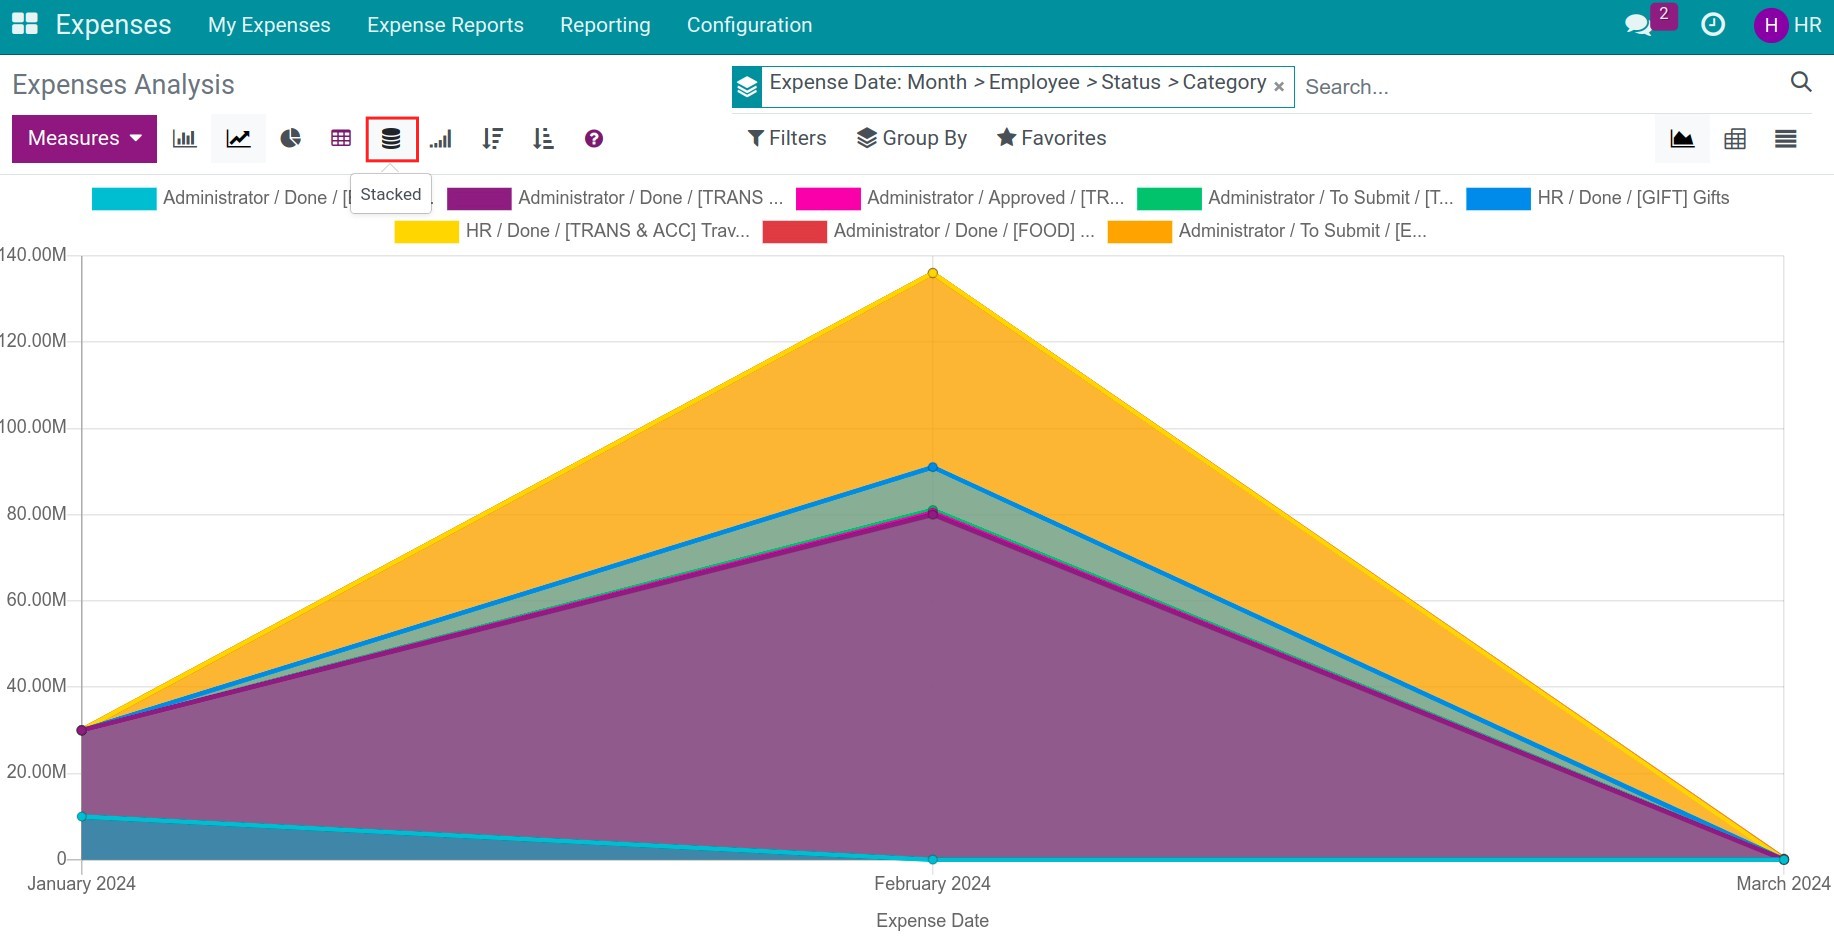
Stacked chart
Cumulative chart
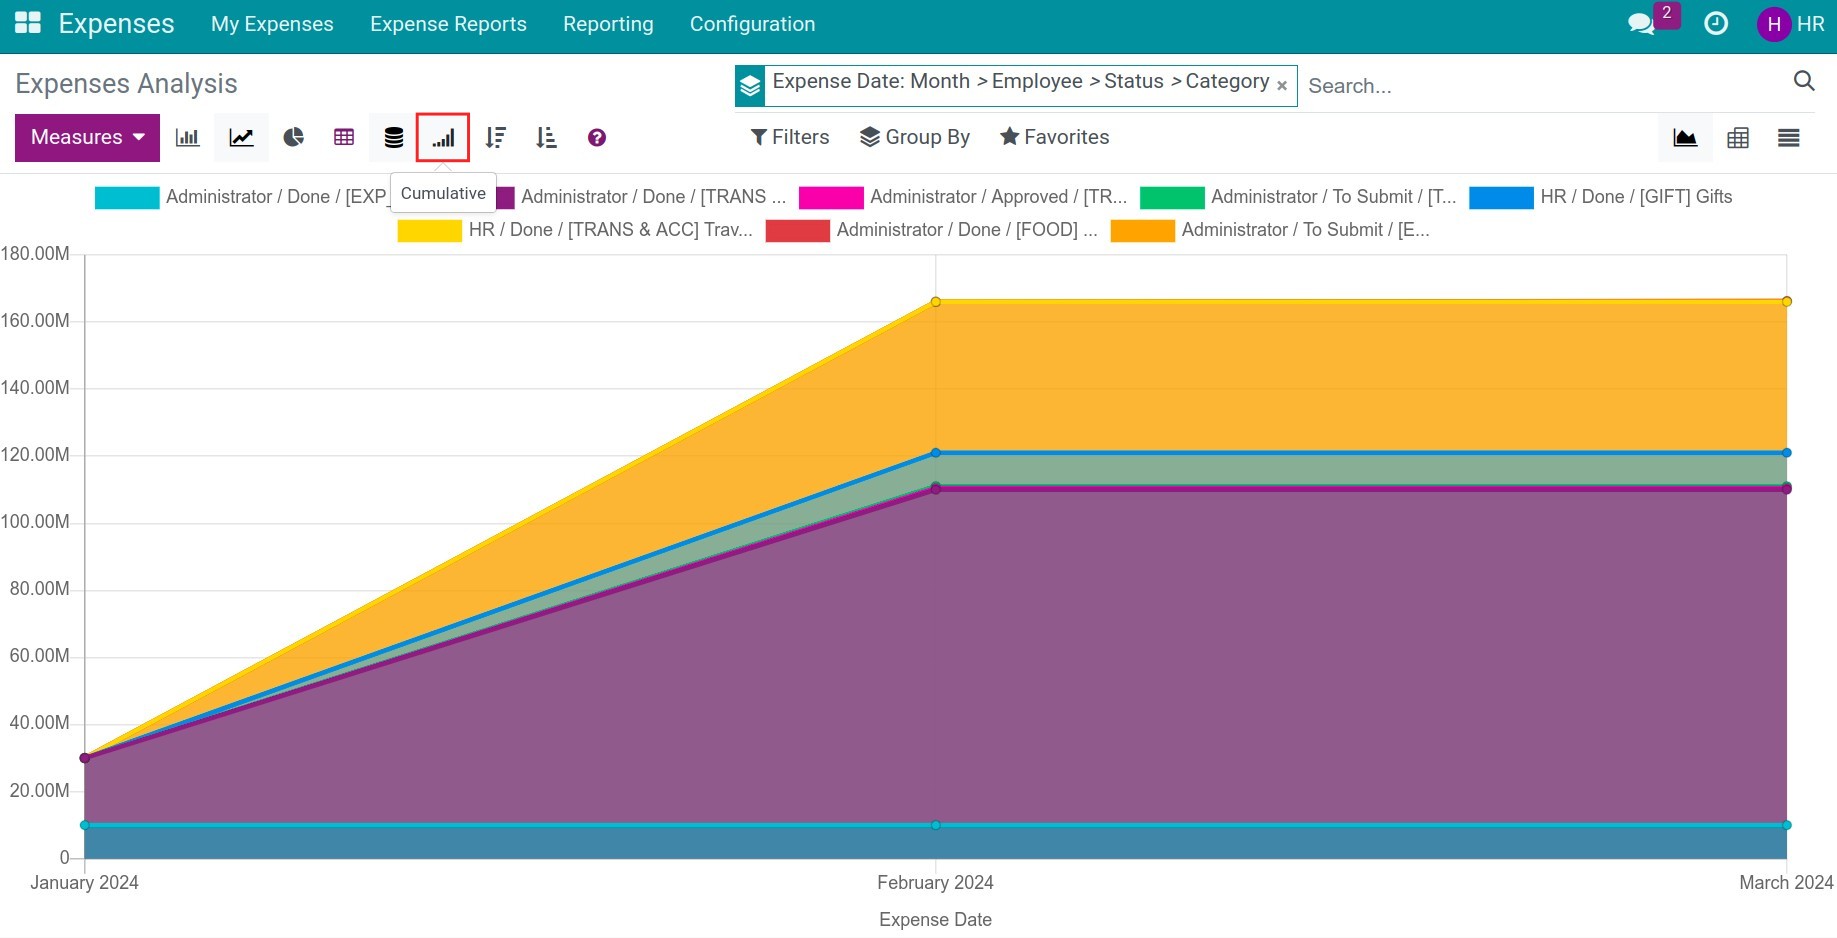
Vertical axis: displays the criteria in the Measures.
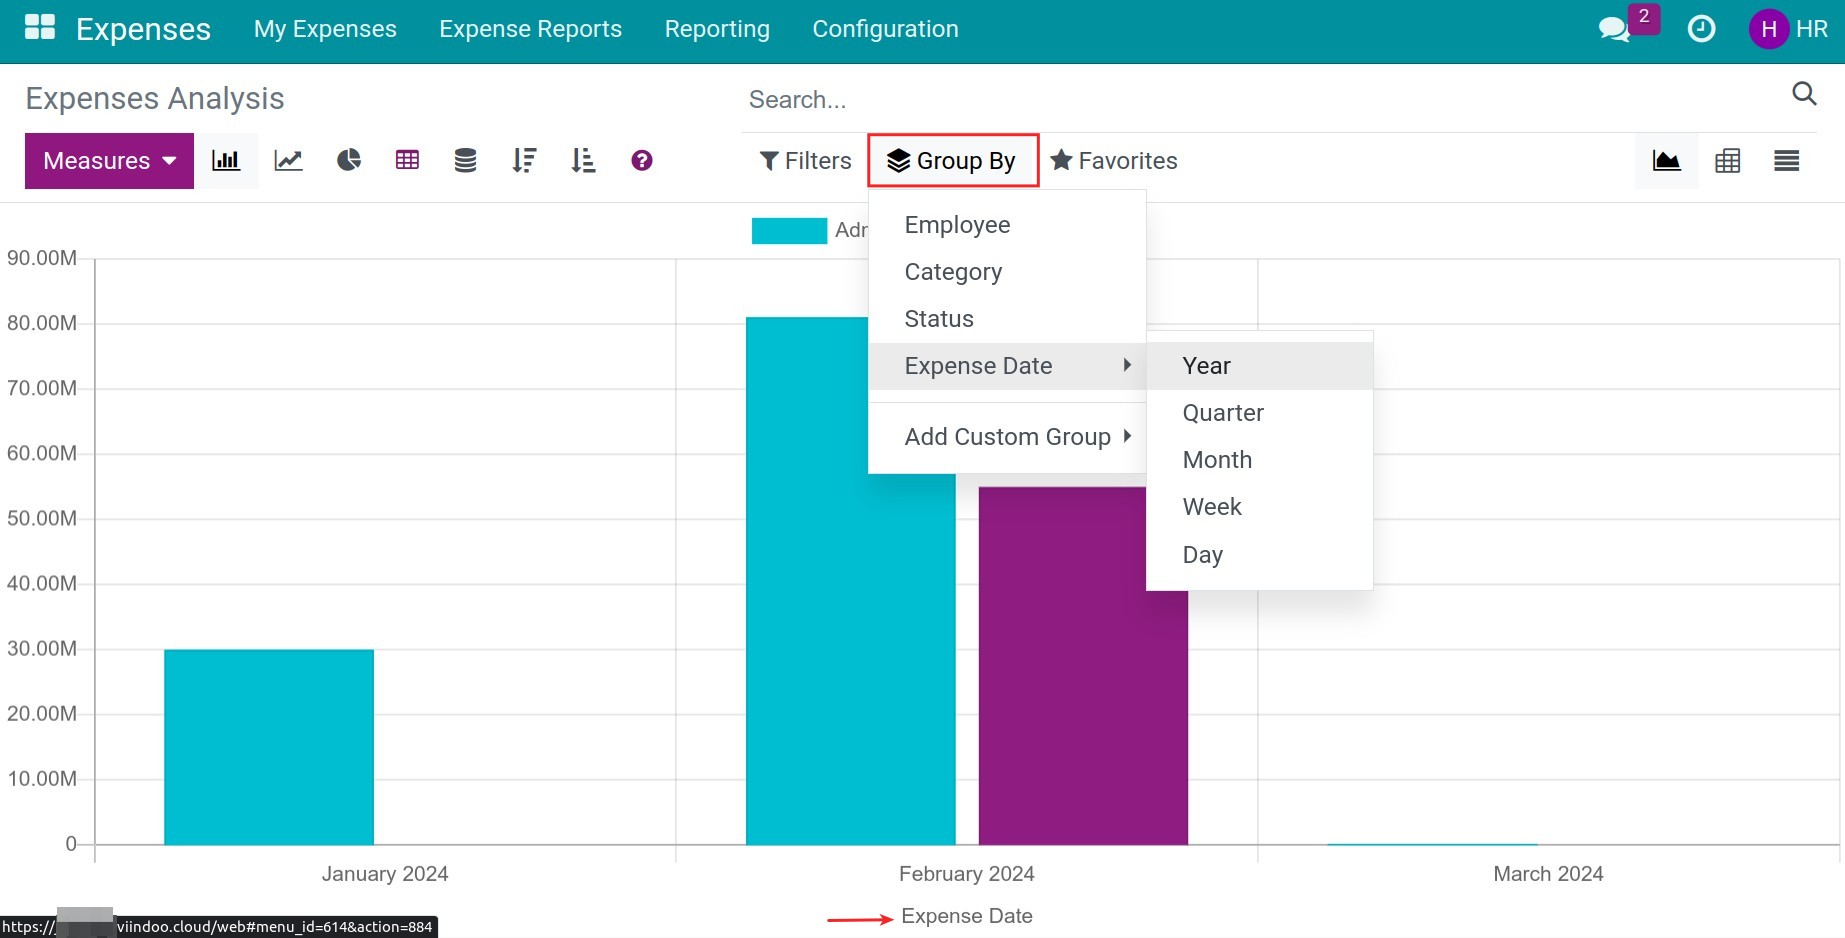
Horizontal axis: displays the criteria of the Group By feature.
Note
Besides from Measures and Group By, you can also use the Filters feature to view the report you want (refer to How to use Filter, Groups and Search use cases).
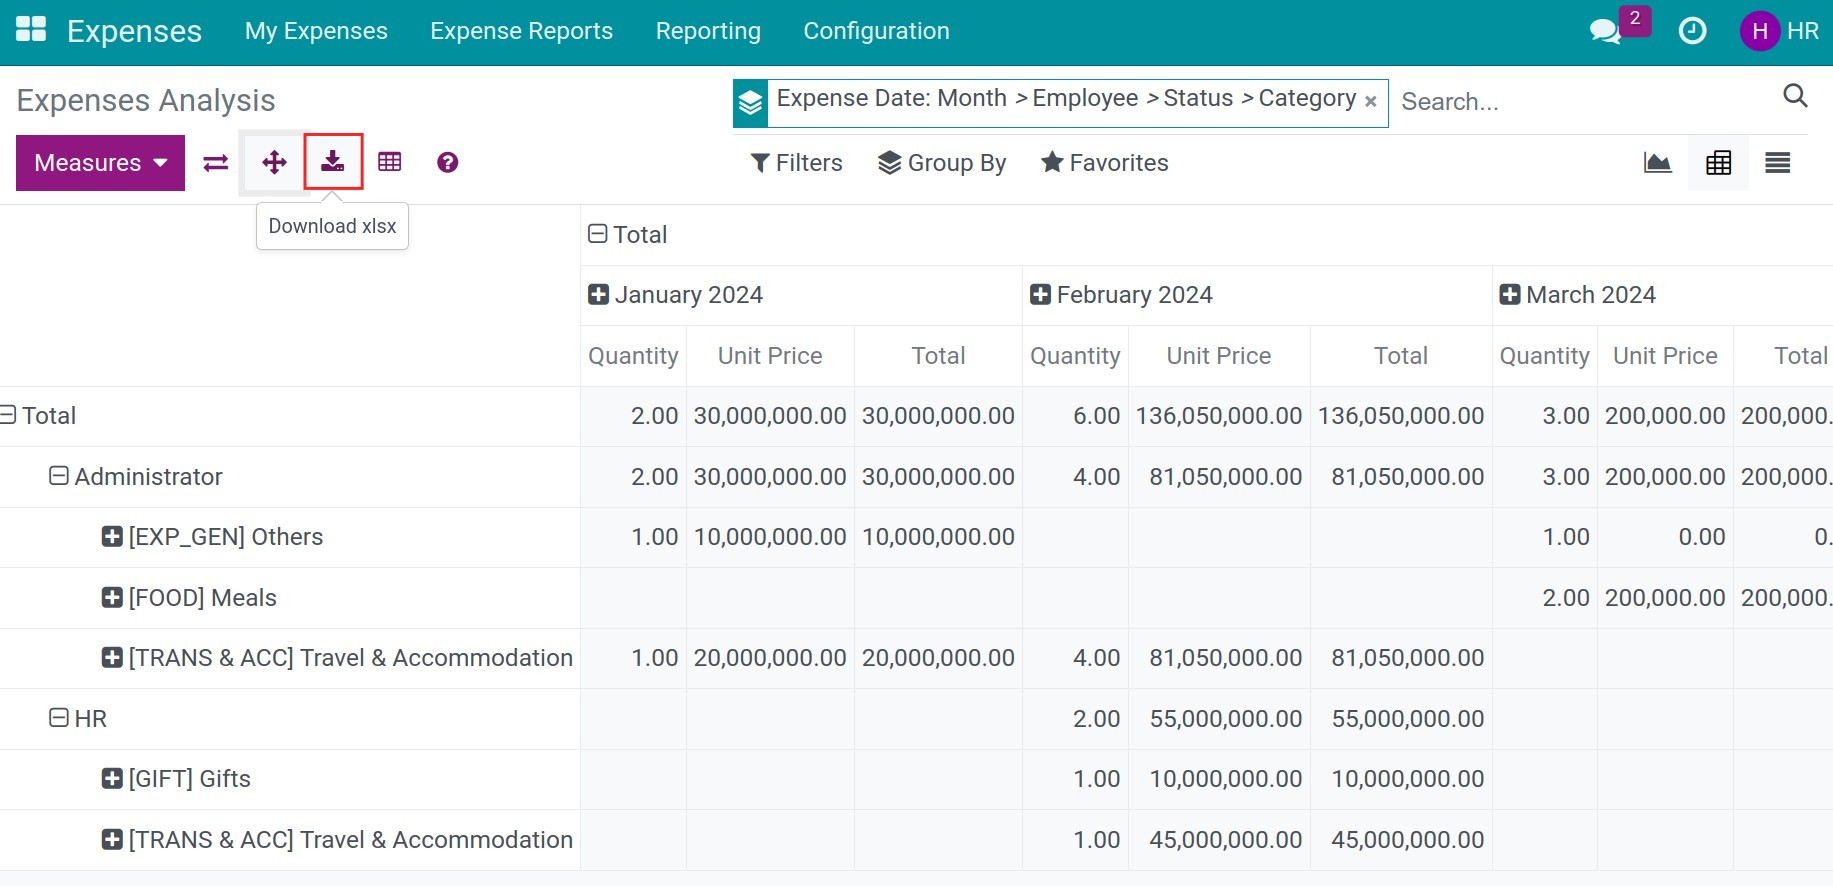
Pivot Report
At the Expenses Analysis view, press the View pivot icon to view the report in the pivot.

Use ”+” to add the criteria onto the pivot.
Use ”-” to hide the criteria.
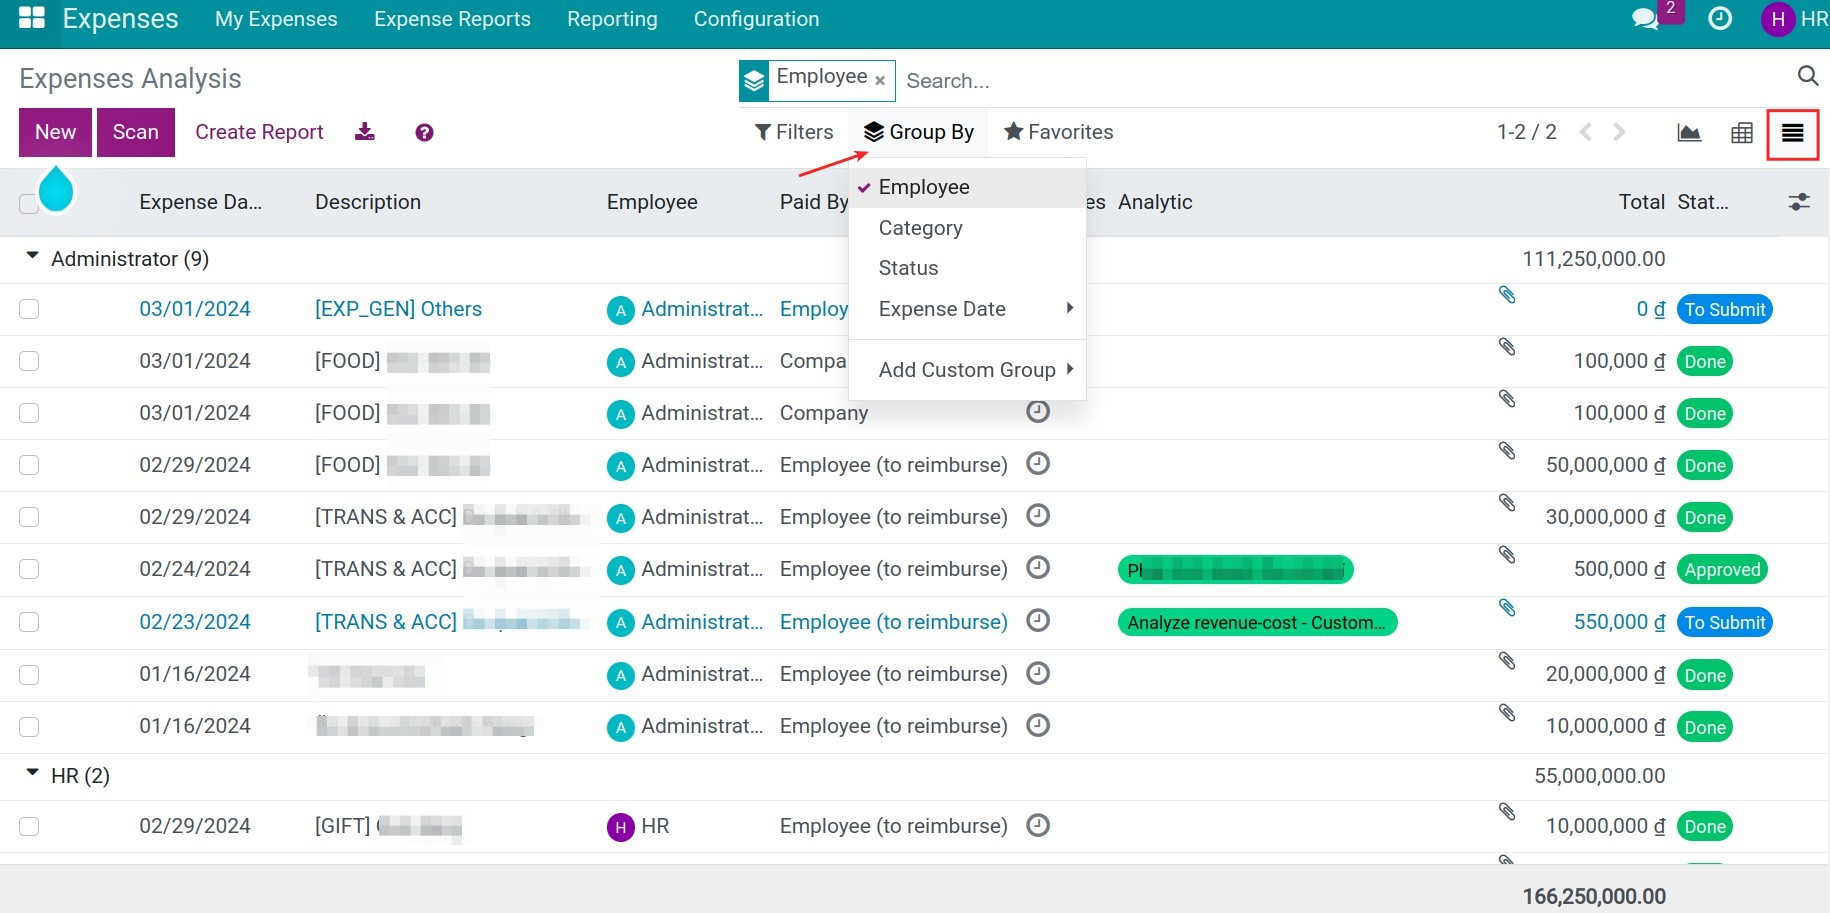
List Report
At the Expenses Analysis view, press the View list icon to view the reports in a list.
Use the Filters, Group By feature to view the report with needed criteria.
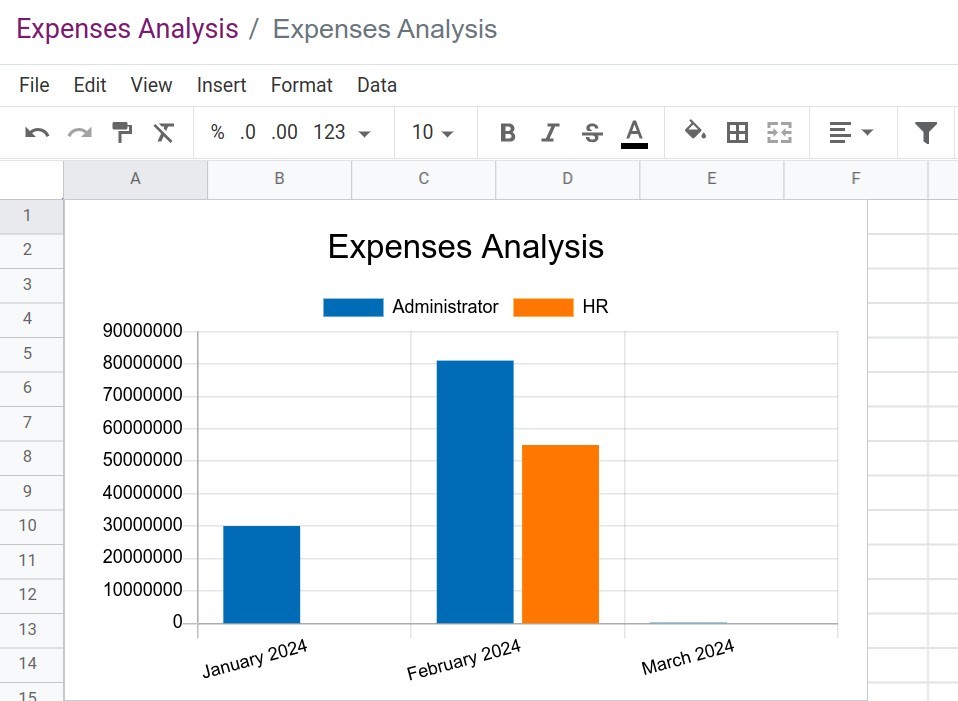
Other features to analyze
In the Graph chart and Pivot chart view, you can press the Add to spreadsheet icon to add the chart to the spreadsheet to analyze:
In the Pivot chart and List chart view, you can press the Download xlxs icon to download the analysis data to Excel:
See also
Related article
Optional module